Quantitative Market Research: Fundamentals, Methods, and Applications
- by Alice Ananian
- August 16, 2024

Did you know that 99% of successful businesses use data to drive their decisions? In our increasingly digital world, quantitative market research has become an essential tool. It doesn’t just provide random facts; it offers precise insights into consumer behavior, market trends, and competitive landscapes, giving businesses the edge they need to storm ahead.
This article explores the fundamentals, methods, and applications of quantitative market research, helping business owners, marketing professionals, and entrepreneurs improve their decision-making and drive their businesses forward.

What is Quantitative Market Research?
Quantitative market research is a methodical approach to gather and analyze numerical data, offering businesses a practical understanding of customer behavior and market trends.
This can be part of both primary and secondary market research. Quantitative market research predominantly relies on structured tools like surveys, polls, and questionnaires to collect quantifiable pieces of information such as percentages, frequencies, and ratings. This research is carried out on a large, representative sample of the target audience to ensure accurate reflection of widespread attitudes and behaviors.
Following the data collection, statistical techniques are applied to reveal patterns, track trends, and identify relationships, effectively converting raw data into actionable insights to guide marketing strategies.
Quantitative vs. Qualitative Research
To fully appreciate quantitative research, it’s essential to understand how it differs from qualitative market research:
| Data Type | Numerical | Textual, visual |
| Sample Size | Large | Small |
| Data Collection | Structured surveys, experiments | Interviews, focus groups, observations |
| Analysis | Statistical | Interpretive |
| Outcome | Generalizable findings | In-depth insights |
| Question Types | Closed-ended | Open-ended |
| Flexibility | Low (standardized approach) | High (adaptable to responses) |
While quantitative research provides broad, generalizable insights, qualitative research offers deeper, context-rich understanding. Many successful market research strategies combine both approaches to gain a comprehensive view of the market.
Applications of Quantitative Market Research
Quantitative market research finds applications across various business functions and industries. Here are some key areas where this research method proves invaluable:
Product Development
- Measuring consumer preferences for product features: This involves surveying potential customers to rank or rate different product features, helping companies prioritize which features to include or improve.
- Assessing market demand for new products: Researchers can use quantitative methods to estimate the potential market size and gauge consumer interest in a new product concept before investing in development .
- Evaluating pricing strategies: Through techniques like conjoint analysis or price sensitivity meters, companies can determine optimal price points that maximize both sales and profitability.
Brand Management
- Tracking brand awareness and perception: Regular surveys can measure how many consumers recognize a brand and what associations they have with it, allowing companies to monitor their brand’s health over time.
- Measuring brand loyalty and customer satisfaction: Quantitative research can assess how likely customers are to repurchase or recommend a brand, providing insights into customer retention strategies.
- Comparing brand performance against competitors: Competitive benchmarking surveys can reveal a brand’s strengths and weaknesses relative to competitors in various attributes.
Customer Segmentation
- Identifying distinct customer groups: By analyzing survey data on demographics, behaviors, and preferences, researchers can use cluster analysis to group customers with similar characteristics.
- Determining the size and value of different market segments: Once segments are identified, quantitative research can estimate the size of each segment and its potential value to the business.
Advertising Effectiveness
- Measuring ad recall and recognition: Surveys conducted after ad campaigns can quantify how many people remember seeing an ad and can correctly identify the brand associated with it.
- Assessing the impact of advertising on purchase intent: Researchers can measure how exposure to ads influences consumers’ likelihood to buy a product, helping to justify advertising spend.
- Evaluating return on investment for marketing campaigns: By linking advertising exposure data with sales data, companies can calculate the ROI of their marketing efforts.
Market Sizing and Forecasting
- Estimating market size and growth potential: Using survey data and secondary sources, researchers can quantify the current market size and project future growth based on trends and economic factors.
- Projecting future sales and market share: Time series analysis and regression models can be used to forecast a company’s sales and market share based on historical data and market conditions.
Customer Experience
- Measuring customer satisfaction and loyalty: Regular surveys can track customer satisfaction scores and Net Promoter Scores (NPS) to gauge overall customer sentiment and loyalty.
- Identifying pain points in the customer journey: Quantitative analysis of customer feedback can highlight common issues or areas of dissatisfaction in the customer experience.
- Quantifying the impact of service improvements: By measuring customer satisfaction before and after implementing changes, companies can assess the effectiveness of their improvement initiatives.
Competitive Analysis
- Benchmarking product or service performance: Surveys can compare how a company’s offerings stack up against competitors on various attributes, helping identify areas for improvement.
- Assessing market share and competitive positioning: Regular tracking studies can monitor changes in market share and brand positioning relative to competitors, informing strategic decisions.
Benefits and Challenges of Quantitative Market Research
Quantitative market research offers a range of advantages that make it a valuable tool for businesses seeking data-driven insights. Understanding these benefits can help organizations leverage this research method effectively to inform their strategies and decision-making processes.
Objectivity: Quantitative research provides unbiased, numerical data that can be statistically analyzed. This objectivity ensures that the findings are not influenced by the researcher’s personal biases or perspectives.
Generalizability: Results derived from large sample sizes can be extrapolated to represent the broader population. This means that the findings are more likely to be valid for all individuals within the target group, enhancing the reliability of the study.
Comparability: Standardized data collection methods allow for easy comparison across different time periods or market segments. This comparability is crucial for tracking changes and trends over time, as well as for identifying differences between various subgroups.
Scalability: Quantitative research methods can efficiently gather data from large sample sizes. This scalability makes it possible to conduct studies on a much larger scale, providing more comprehensive insights into the research question.
Hypothesis testing: Quantitative research enables researchers to test specific theories or assumptions about market behavior. By confirming or disproving these hypotheses, researchers can gain a deeper understanding of the factors driving market trends and consumer behaviors.
Decision support: The concrete data obtained from quantitative research provides a solid foundation to support strategic decision-making. This evidence-based approach facilitates more informed and effective decisions, reducing the risk of error and improving outcomes.
While quantitative market research provides numerous advantages, it’s important to recognize that this approach also comes with its own set of limitations and potential pitfalls. Being aware of these challenges can help researchers and businesses plan more effectively and interpret results with appropriate caution.
Limited depth: Quantitative research methods may not capture the nuanced reasons behind consumer behavior or attitudes, often resulting in a superficial understanding of complex issues.
Inflexibility: Structured surveys and experiments may miss unexpected insights that could emerge in more open-ended research methods, limiting the scope of discovery.
Response bias: Respondents may not always provide honest or accurate answers, particularly on sensitive or personal topics, leading to skewed data and unreliable conclusions.
Cost: Conducting large-scale surveys or experiments can be expensive, often requiring significant financial resources for data collection, participant incentives, and analysis.
Time-consuming: The proper design, implementation, and analysis of quantitative research can be time-intensive, potentially delaying the results and impacting project timelines.
Expertise required: Quantitative research requires extensive knowledge of statistical analysis and research methodologies, necessitating skilled professionals to ensure accurate and reliable outcomes.
Examples of Quantitative Market Research
To illustrate the practical applications of quantitative market research, let’s explore some real-world examples:
Netflix A/B Testing Titles
Ever noticed how Netflix displays different titles or artwork for the same movie or show depending on your profile? This is A/B testing, a form of quantitative research. Netflix uses surveys and click-through rates to determine which title or artwork generates the most clicks and engagement.
Spotify Optimizing Playlists
How does Spotify create those eerily perfect playlists that seem to know exactly what you’re in the mood for? Quantitative research plays a role! Spotify analyzes user listening habits, including skip rates, play time, and song popularity, to curate playlists that resonate with different user preferences.
Coca-Cola Testing New Flavors
Developing a new beverage flavor requires understanding consumer preferences. Coca-Cola uses surveys and taste tests to gather quantitative data on sweetness levels, flavor combinations, and overall appeal. This data helps them refine new flavors before a full-scale launch.
Apple gauging iPhone Screen Size Preferences
Before increasing iPhone screen sizes, Apple likely conducted quantitative research. Online surveys and focus groups could have gathered data on user preferences for screen size, one-handed usability, and content viewing experience. This data likely helped Apple determine the optimal screen size for future iPhones.
Dominos Revamping its Pizza Recipe
In 2009, Domino ‘s faced declining sales. Quantitative research came to the rescue. Domino’s conducted customer surveys and taste tests to understand customer dissatisfaction with its pizza crust and sauce. Based on the findings, they revamped the recipe, leading to a significant turnaround in customer satisfaction and sales.
These are just a few examples, but they showcase the power of quantitative research in helping businesses make data-driven decisions that resonate with their target audiences.
Tools and Resources for Quantitative Research
To conduct effective quantitative market research, consider utilizing these tools and resources :
Survey Platforms
Qualtrics : Comprehensive survey software with advanced analytics
Prelaunch : Lets you gather data via a landing page that concisely presents your product
SurveyMonkey : User-friendly platform for creating and distributing surveys
Google Forms : Free tool for basic surveys and data collection
Statistical Analysis Software
SPSS : Powerful software for complex statistical analysis
R : Open-source programming language for statistical computing
Prelaunch : The platform is a comprehensive concept-validating tool that complies and presents the data you gather via your product’s landing page into insightful section that make it easier to make data-driven decisions.
Excel : Suitable for basic data analysis and visualization
Online Panel Providers
Dynata : Large global panel for diverse respondent recruitment
Amazon Mechanical Turk : Platform for crowdsourcing survey participants
Data Visualization Tools
Tableau : Creates interactive data visualizations and dashboards
Power BI : Microsoft’s business analytics tool for data visualization
Datawrapper : User-friendly tool for creating charts and maps
Market Research Associations
ESOMAR : Global voice of the data, research, and insights community
Insights Association : Leading voice, resource, and network of the marketing research and data analytics community
Academic Resources
Journal of Marketing Research : Scholarly journal featuring cutting-edge research methodologies
Market Research Society (MRS) : Provides training, qualifications, and resources for market researchers
Remember to choose tools that align with your research objectives, budget, and level of expertise. Many of these platforms offer free trials or basic versions, allowing you to experiment before committing to a paid solution.
Quantitative market research is a powerful tool for making data-driven decisions. By providing objective, measurable insights into consumer behavior and market trends, it helps businesses develop targeted strategies and stay ahead of the competition.
While it has its limitations, combining quantitative methods with qualitative approaches can offer a comprehensive market understanding. Careful planning, rigorous methodology, and thoughtful interpretation of results are key to successful quantitative research.
Embrace the power of numbers and let data guide your business success.

Alice Ananian
Alice has over 8 years experience as a strong communicator and creative thinker. She enjoys helping companies refine their branding, deepen their values, and reach their intended audiences through language.
Related Articles

Million Dollar Business Ideas
- by Iskouhie Poladian
- April 9, 2024

All About Pet Industry Trends
- by Lili Avetyan
- December 19, 2023
- Privacy Policy
Home » Quantitative Research – Methods, Types and Analysis
Quantitative Research – Methods, Types and Analysis
Table of Contents

Quantitative Research
Quantitative research is a type of research that collects and analyzes numerical data to test hypotheses and answer research questions . This research typically involves a large sample size and uses statistical analysis to make inferences about a population based on the data collected. It often involves the use of surveys, experiments, or other structured data collection methods to gather quantitative data.
Quantitative Research Methods

Quantitative Research Methods are as follows:
Descriptive Research Design
Descriptive research design is used to describe the characteristics of a population or phenomenon being studied. This research method is used to answer the questions of what, where, when, and how. Descriptive research designs use a variety of methods such as observation, case studies, and surveys to collect data. The data is then analyzed using statistical tools to identify patterns and relationships.
Correlational Research Design
Correlational research design is used to investigate the relationship between two or more variables. Researchers use correlational research to determine whether a relationship exists between variables and to what extent they are related. This research method involves collecting data from a sample and analyzing it using statistical tools such as correlation coefficients.
Quasi-experimental Research Design
Quasi-experimental research design is used to investigate cause-and-effect relationships between variables. This research method is similar to experimental research design, but it lacks full control over the independent variable. Researchers use quasi-experimental research designs when it is not feasible or ethical to manipulate the independent variable.
Experimental Research Design
Experimental research design is used to investigate cause-and-effect relationships between variables. This research method involves manipulating the independent variable and observing the effects on the dependent variable. Researchers use experimental research designs to test hypotheses and establish cause-and-effect relationships.
Survey Research
Survey research involves collecting data from a sample of individuals using a standardized questionnaire. This research method is used to gather information on attitudes, beliefs, and behaviors of individuals. Researchers use survey research to collect data quickly and efficiently from a large sample size. Survey research can be conducted through various methods such as online, phone, mail, or in-person interviews.
Quantitative Research Analysis Methods
Here are some commonly used quantitative research analysis methods:
Statistical Analysis
Statistical analysis is the most common quantitative research analysis method. It involves using statistical tools and techniques to analyze the numerical data collected during the research process. Statistical analysis can be used to identify patterns, trends, and relationships between variables, and to test hypotheses and theories.
Regression Analysis
Regression analysis is a statistical technique used to analyze the relationship between one dependent variable and one or more independent variables. Researchers use regression analysis to identify and quantify the impact of independent variables on the dependent variable.
Factor Analysis
Factor analysis is a statistical technique used to identify underlying factors that explain the correlations among a set of variables. Researchers use factor analysis to reduce a large number of variables to a smaller set of factors that capture the most important information.
Structural Equation Modeling
Structural equation modeling is a statistical technique used to test complex relationships between variables. It involves specifying a model that includes both observed and unobserved variables, and then using statistical methods to test the fit of the model to the data.
Time Series Analysis
Time series analysis is a statistical technique used to analyze data that is collected over time. It involves identifying patterns and trends in the data, as well as any seasonal or cyclical variations.
Multilevel Modeling
Multilevel modeling is a statistical technique used to analyze data that is nested within multiple levels. For example, researchers might use multilevel modeling to analyze data that is collected from individuals who are nested within groups, such as students nested within schools.
Applications of Quantitative Research
Quantitative research has many applications across a wide range of fields. Here are some common examples:
- Market Research : Quantitative research is used extensively in market research to understand consumer behavior, preferences, and trends. Researchers use surveys, experiments, and other quantitative methods to collect data that can inform marketing strategies, product development, and pricing decisions.
- Health Research: Quantitative research is used in health research to study the effectiveness of medical treatments, identify risk factors for diseases, and track health outcomes over time. Researchers use statistical methods to analyze data from clinical trials, surveys, and other sources to inform medical practice and policy.
- Social Science Research: Quantitative research is used in social science research to study human behavior, attitudes, and social structures. Researchers use surveys, experiments, and other quantitative methods to collect data that can inform social policies, educational programs, and community interventions.
- Education Research: Quantitative research is used in education research to study the effectiveness of teaching methods, assess student learning outcomes, and identify factors that influence student success. Researchers use experimental and quasi-experimental designs, as well as surveys and other quantitative methods, to collect and analyze data.
- Environmental Research: Quantitative research is used in environmental research to study the impact of human activities on the environment, assess the effectiveness of conservation strategies, and identify ways to reduce environmental risks. Researchers use statistical methods to analyze data from field studies, experiments, and other sources.
Characteristics of Quantitative Research
Here are some key characteristics of quantitative research:
- Numerical data : Quantitative research involves collecting numerical data through standardized methods such as surveys, experiments, and observational studies. This data is analyzed using statistical methods to identify patterns and relationships.
- Large sample size: Quantitative research often involves collecting data from a large sample of individuals or groups in order to increase the reliability and generalizability of the findings.
- Objective approach: Quantitative research aims to be objective and impartial in its approach, focusing on the collection and analysis of data rather than personal beliefs, opinions, or experiences.
- Control over variables: Quantitative research often involves manipulating variables to test hypotheses and establish cause-and-effect relationships. Researchers aim to control for extraneous variables that may impact the results.
- Replicable : Quantitative research aims to be replicable, meaning that other researchers should be able to conduct similar studies and obtain similar results using the same methods.
- Statistical analysis: Quantitative research involves using statistical tools and techniques to analyze the numerical data collected during the research process. Statistical analysis allows researchers to identify patterns, trends, and relationships between variables, and to test hypotheses and theories.
- Generalizability: Quantitative research aims to produce findings that can be generalized to larger populations beyond the specific sample studied. This is achieved through the use of random sampling methods and statistical inference.
Examples of Quantitative Research
Here are some examples of quantitative research in different fields:
- Market Research: A company conducts a survey of 1000 consumers to determine their brand awareness and preferences. The data is analyzed using statistical methods to identify trends and patterns that can inform marketing strategies.
- Health Research : A researcher conducts a randomized controlled trial to test the effectiveness of a new drug for treating a particular medical condition. The study involves collecting data from a large sample of patients and analyzing the results using statistical methods.
- Social Science Research : A sociologist conducts a survey of 500 people to study attitudes toward immigration in a particular country. The data is analyzed using statistical methods to identify factors that influence these attitudes.
- Education Research: A researcher conducts an experiment to compare the effectiveness of two different teaching methods for improving student learning outcomes. The study involves randomly assigning students to different groups and collecting data on their performance on standardized tests.
- Environmental Research : A team of researchers conduct a study to investigate the impact of climate change on the distribution and abundance of a particular species of plant or animal. The study involves collecting data on environmental factors and population sizes over time and analyzing the results using statistical methods.
- Psychology : A researcher conducts a survey of 500 college students to investigate the relationship between social media use and mental health. The data is analyzed using statistical methods to identify correlations and potential causal relationships.
- Political Science: A team of researchers conducts a study to investigate voter behavior during an election. They use survey methods to collect data on voting patterns, demographics, and political attitudes, and analyze the results using statistical methods.
How to Conduct Quantitative Research
Here is a general overview of how to conduct quantitative research:
- Develop a research question: The first step in conducting quantitative research is to develop a clear and specific research question. This question should be based on a gap in existing knowledge, and should be answerable using quantitative methods.
- Develop a research design: Once you have a research question, you will need to develop a research design. This involves deciding on the appropriate methods to collect data, such as surveys, experiments, or observational studies. You will also need to determine the appropriate sample size, data collection instruments, and data analysis techniques.
- Collect data: The next step is to collect data. This may involve administering surveys or questionnaires, conducting experiments, or gathering data from existing sources. It is important to use standardized methods to ensure that the data is reliable and valid.
- Analyze data : Once the data has been collected, it is time to analyze it. This involves using statistical methods to identify patterns, trends, and relationships between variables. Common statistical techniques include correlation analysis, regression analysis, and hypothesis testing.
- Interpret results: After analyzing the data, you will need to interpret the results. This involves identifying the key findings, determining their significance, and drawing conclusions based on the data.
- Communicate findings: Finally, you will need to communicate your findings. This may involve writing a research report, presenting at a conference, or publishing in a peer-reviewed journal. It is important to clearly communicate the research question, methods, results, and conclusions to ensure that others can understand and replicate your research.
When to use Quantitative Research
Here are some situations when quantitative research can be appropriate:
- To test a hypothesis: Quantitative research is often used to test a hypothesis or a theory. It involves collecting numerical data and using statistical analysis to determine if the data supports or refutes the hypothesis.
- To generalize findings: If you want to generalize the findings of your study to a larger population, quantitative research can be useful. This is because it allows you to collect numerical data from a representative sample of the population and use statistical analysis to make inferences about the population as a whole.
- To measure relationships between variables: If you want to measure the relationship between two or more variables, such as the relationship between age and income, or between education level and job satisfaction, quantitative research can be useful. It allows you to collect numerical data on both variables and use statistical analysis to determine the strength and direction of the relationship.
- To identify patterns or trends: Quantitative research can be useful for identifying patterns or trends in data. For example, you can use quantitative research to identify trends in consumer behavior or to identify patterns in stock market data.
- To quantify attitudes or opinions : If you want to measure attitudes or opinions on a particular topic, quantitative research can be useful. It allows you to collect numerical data using surveys or questionnaires and analyze the data using statistical methods to determine the prevalence of certain attitudes or opinions.
Purpose of Quantitative Research
The purpose of quantitative research is to systematically investigate and measure the relationships between variables or phenomena using numerical data and statistical analysis. The main objectives of quantitative research include:
- Description : To provide a detailed and accurate description of a particular phenomenon or population.
- Explanation : To explain the reasons for the occurrence of a particular phenomenon, such as identifying the factors that influence a behavior or attitude.
- Prediction : To predict future trends or behaviors based on past patterns and relationships between variables.
- Control : To identify the best strategies for controlling or influencing a particular outcome or behavior.
Quantitative research is used in many different fields, including social sciences, business, engineering, and health sciences. It can be used to investigate a wide range of phenomena, from human behavior and attitudes to physical and biological processes. The purpose of quantitative research is to provide reliable and valid data that can be used to inform decision-making and improve understanding of the world around us.
Advantages of Quantitative Research
There are several advantages of quantitative research, including:
- Objectivity : Quantitative research is based on objective data and statistical analysis, which reduces the potential for bias or subjectivity in the research process.
- Reproducibility : Because quantitative research involves standardized methods and measurements, it is more likely to be reproducible and reliable.
- Generalizability : Quantitative research allows for generalizations to be made about a population based on a representative sample, which can inform decision-making and policy development.
- Precision : Quantitative research allows for precise measurement and analysis of data, which can provide a more accurate understanding of phenomena and relationships between variables.
- Efficiency : Quantitative research can be conducted relatively quickly and efficiently, especially when compared to qualitative research, which may involve lengthy data collection and analysis.
- Large sample sizes : Quantitative research can accommodate large sample sizes, which can increase the representativeness and generalizability of the results.
Limitations of Quantitative Research
There are several limitations of quantitative research, including:
- Limited understanding of context: Quantitative research typically focuses on numerical data and statistical analysis, which may not provide a comprehensive understanding of the context or underlying factors that influence a phenomenon.
- Simplification of complex phenomena: Quantitative research often involves simplifying complex phenomena into measurable variables, which may not capture the full complexity of the phenomenon being studied.
- Potential for researcher bias: Although quantitative research aims to be objective, there is still the potential for researcher bias in areas such as sampling, data collection, and data analysis.
- Limited ability to explore new ideas: Quantitative research is often based on pre-determined research questions and hypotheses, which may limit the ability to explore new ideas or unexpected findings.
- Limited ability to capture subjective experiences : Quantitative research is typically focused on objective data and may not capture the subjective experiences of individuals or groups being studied.
- Ethical concerns : Quantitative research may raise ethical concerns, such as invasion of privacy or the potential for harm to participants.
About the author

Muhammad Hassan
Researcher, Academic Writer, Web developer
You may also like

Focus Groups – Steps, Examples and Guide

Triangulation in Research – Types, Methods and...

Case Study – Methods, Examples and Guide

Qualitative Research – Methods, Analysis Types...

One-to-One Interview – Methods and Guide

Phenomenology – Methods, Examples and Guide
- Pollfish School
- Market Research
- Survey Guides
- Get started
The Complete Guide to Quantitative Market Research

Quantitative research is a chief category in the research sphere, along with qualitative research. An encompassing aspect of market research , it can include both primary and secondary methods of extracting data.
Although used interchangeably with qualitative research, quantitative research is a distinct process that should not be confused with its counterpart. In fact, it is the opposite of qualitative research.
Let’s navigate through the waters of quantitative research in this complete guide.
What Defines & Makes Up Quantitative Research?
As its name suggests, quantitative research is the process of aggregating quantitative, or numerical data for research purposes. This data is used for a number of applications. These include:
- Quantifying opinions, behaviors, attitudes and problems
- Making generalizations
- Forming predictions
- Discovering patterns
- Determining averages
- Testing relationships
Quantitative research generally relies on a larger sample size in order to quantify any issue or variable. In order to achieve this, this research method involves using mathematical and statistical means.
This type of research answers the “what” and the “how much” of a subject within a research endeavor. As it forms generalizations, this type of method involves surveying a larger population, using measurable data and processing all the data first and then analyzing it from a statistical standpoint.
The Four Main Types of Quantitative Research
There are four main ways to perform quantitative research. Aside from their methodology, these sub-categories also seek different types of answers and conclusions.
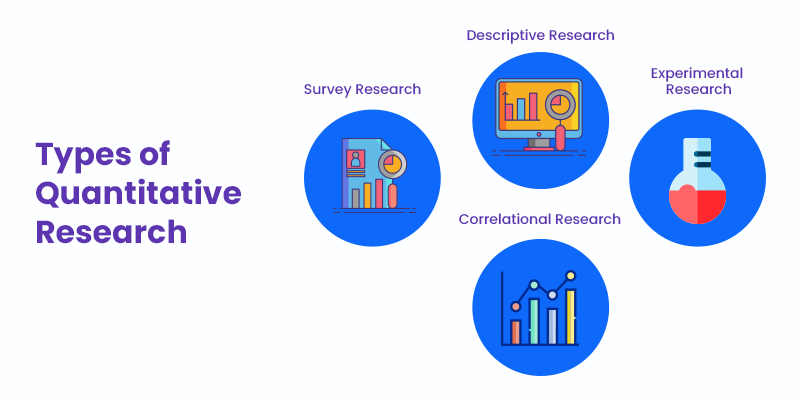
1. Descriptive Research
This is used to determine the state of variables. It describes the situation and environment surrounding a variable or topic. As such, it is used for arranging comparisons, outlining sample characteristics, overlooking emerging trends and confirming existing phenomena.
The data is collected by way of observation. Descriptive Research is used to form a hypothesis, but only after having aggregated all the necessary data.
2. Correlational Research
This research method is used to examine the relationships between different subjects and variables. Analyzing relationships is necessary to either test a hypothesis or a prediction. Because this research focuses on relationships between fixed variables, other outlying variables are not part of the investigation.
Correlational research is in direct opposition to experimental research, as none of the studied variables are manipulated. Correlations can be either positive or negative, with different degrees of the relationship’s strength.
3. Experimental Research
This method is used for finding whether there is a cause and effect relationship among variables. This kind of research relies on the scientific method. Unlike correlational research, experimental research involves manipulating variables.
Researchers would manipulate a variable to uncover its effect on another one. This method is frequently referred to as true experimentation, as no experimental undertaking leaves all variables unchanged; at least one must be influenced in some way.
This includes manipulating, randomizing or reverting back a variable. The variables are then measured, calculated and compared.
4. Survey Research
The final research method is crucial to understanding behavior. In market research, it is often used to acclimate a brand with its target market’s desires, needs, points of contention and behaviors.
Surveys allow researchers to ask pointed questions to either discover their target audience or get a granular sense of their opinions. As such, they can be conducted within one group or many, for the sake of comparison.
Instead of turning to survey panels , which are likely to have skewed or biased results, researchers should use a random sample of people. A non-panel-based survey will garner more respondents that aren’t motivated by professional compensation.
Surveys can be administered by mail, in-person, on the phone, or digitally. The latter has even more options: online surveys, third-party surveys, emails and in-app.
Examples of Questions for Quantitative Research
Survey research has a far larger scope of questions than do the other three types, as researchers can ask practically anything to conduct their studies. However, there are some best practices in survey questionnaires, such as focusing on your industry, your product and the desires of customers.
Learn more about asking insightful market research questions . Here are a few examples of quantitative research questions in the three other categories.
- Is working from home the best option to improve productivity for employees with long commutes? Variable: Working from home and in-office Demographic: Employees with long commutes Quantitative Research Type : Experimental
- How has the coronavirus changed employment for white-collar workers? Variable: Employment types and statuses Demographic: White-collar workers Quantitative Research Type : Experimental
- How often do working people travel for a holiday? Variable: Amount of times respondents travel during a holiday Demographic: working people Quantitative Research Type : Descriptive
- How much would you pay for a subscription to an entertainment magazine? Variable: payments for a magazine subscription Demographic: women aged 14-44, those interested in celebrities Quantitative Research Type : Descriptive
- What is the difference in smartphone usage between Millennials and senior citizens? Variable: Time spent on using a smartphone Demographic: Millennials and seniors Quantitative Research Type: Correlational
- Does the leadership style of car shop owners predict the job satisfaction of car salespeople? Variable: Leadership style and job satisfaction Demographic: Car shop employers and salespeople Quantitative Research Type: Correlational
When to Use Quantitative Research and How to Analyze It
The quantitative research method has specific use cases. You ought to consider which is best for your particular business, which includes your strategy, your marketing and other facets.
The core of quantitative research is to quantify a phenomenon (a problem, an inadequacy, and a slew of other occurrences) and understand its prevalence. Researchers do this by observing large portions of a population.
You should use this form of research whenever you need to be presented with the state of things at a higher level, or from a bird’s eye view. This Is because this type of research can identify links between various factors, look for correlations and discover cause and effect relationships.
Researchers can then use the results of their findings to form predictions. This is useful in market research when launching a new product, brainstorming product ideas or innovations or growing a customer base.
To analyze this research, it should first be made quantifiable and objective. Researchers should pin down the scales and units of measurements in their various studies. Then, they should organize them into easily interpretable formats.
For example, once you gather the numerical data, you can enter it into a spreadsheet. Thereafter, you can organize it by desegregating it into graphs, charts and tables. Finally, you should draw data-based conclusions from your study. You can also do further sleuthing via advanced analytics.
The Benefits and Drawbacks of Quantitative Research
Quantitative research has a bevy of benefits; it also has some hindrances. You should peruse both the positive and negative qualities of this research type before setting out on any major research project. The following may help you choose one form of research over the other, or use aspects of both.
- Larger sample pools: the larger the group of respondents, the more accurate are the results.
- Highly structured: Surveys, questionnaires, and other tools for recording numerical data
- Focused: The design of the study is determined before it begins
- Theory-based: Research tests a theory to provide support/proof
- Designed to Be Analyzed: Numbers/statistics exist as tables, charts, figures and other non-textual forms for easy analysis.
- Objective: Steering clear of bias as the research is separated from the data & only objective responses are sought.
- Direct comparisons of results: The study can be set in different cultural environments, times or different groups of participants with a statistical comparison of results.
- Focuses solely on numbers: This can be limiting as researchers may overlook other data and larger themes.
- Superficial Representations: It cannot adequately describe complex concepts (ex: feelings, opinions) it only shows the numbers behind them.
- Several factors can invalidate results: A hypothesis and a model for collecting/ analyzing data.is required; any mistake can lead to bias and inaccurate illustrations.
- Erred Structure: If any data is missing or if measurements are not clear, biases easily take precedence.
The Final Word on Quantitative Research
Market research is far too encompassing to fully complete, especially in a limited amount of time. To tackle market research, begin with a research method. Quantitative research is often a good starting point, as it shows you the existence of a problem by way of quantifying it.
Aside from confirming the existence, it can help confirm a hypothesis, find correlations and prove cause and effect relationships. A hard set of data can also help you make educated predictions.
While the three types of quantitative research methods are useful, they do have several disadvantages. The fourth one, ie, survey research helps fill in the gaps and inadequacies of numerical limitations. Interestingly enough, they too can be a source of hard data and numbers.
Either way, market research is sure to benefit from incorporating surveys as part of the processes.
Frequently asked questions
What is quantitative market research.
Quantitative market research utilizes the techniques of quantitative research in order to better understand the target market. In quantitative research, the information gathered from surveys and questionnaires is converted into numerical values so it can be easily analyzed.
What types of questions do quantitative research answer?
Quantitative research seeks to define “what” and “how much.” It is used for identifying patterns, making predictions, establishing averages, and quantifying opinions, attitudes or behaviors.
What are the four main types of quantitative research?
The four main types of quantitative research are survey research, correlational research, descriptive research, and experimental research.
What type of surveys are used for quantitative research?
Quantitative surveys are best suited for quantitative research. In this type of survey, there are no open-ended questions, and all responses can be assigned a numerical value. In most cases, a quantitative survey is distributed to a large and random sample of individuals.
Why are large sample sizes important when conducting quantitative research?
A small sample size can lead to inaccurate results. The larger the sample size (i.e. the group of individuals who receive the survey), the more likely it is that the results will be statistically significant and accurate.
Do you want to distribute your survey? Pollfish offers you access to millions of targeted consumers to get survey responses from $0.95 per complete. Launch your survey today.
Privacy Preference Center
Privacy preferences.
Accounting , Administrative assistants , Blog , Data Entry , Ecommerce , Outsourcing , Research , Small Business Owners , Virtual Assistants
Quantitative market research- everything you need to know, table of contents, introduction.
Did you ever wonder how companies like Amazon or Google seem to predict your preferences with uncanny accuracy? The answer often lies in the realm of quantitative market research. But what precisely does this entail, and how does it enable businesses to comprehend consumer behavior with such finesse?
According to recent studies, over 75% of businesses worldwide rely on market research to guide their decision-making processes, highlighting its pivotal role in today’s competitive landscape. By quantifying consumer opinions and behaviors, companies can make informed strategic choices, tailor products and services to meet specific needs, and stay ahead of market trends.
What is Quantitative Market Research?

Quantitative market research is a systematic approach to gathering and analyzing data from a target market. It relies on numerical data and statistical analysis to understand consumer behavior, preferences, and trends. This method involves collecting data through structured surveys, questionnaires, and experiments conducted with a large sample size representative of the target population. The objective is to obtain measurable insights into consumer opinions, attitudes, and purchasing habits.
One of the key advantages of quantitative marketing research is its ability to provide precise and quantifiable data. By using statistical techniques such as regression analysis, correlation, and hypothesis testing, researchers can identify patterns and relationships within the data, allowing for informed decision-making. This data-driven approach enables businesses to make strategic decisions regarding product development, pricing strategies, and marketing campaigns.
Furthermore, quantitative research allows for generalization of findings to a larger population. With a sizable and diverse sample, researchers can draw conclusions that are applicable beyond the study group. This scalability enhances the reliability and validity of the research findings, providing businesses with confidence in their market strategies. Overall, quantitative market research serves as a powerful tool for businesses seeking to understand market dynamics and make data-driven decisions in an increasingly competitive landscape.
Common Types Of Quantitative Market Research

Quantitative market research encompasses various methods tailored to gather numerical data for analysis. Some common types include surveys, experiments, and observational studies.
Surveys are one of the most widely used methods in quantitative market research. They involve structured questionnaires administered to a representative sample of the target population. Surveys can be conducted through various channels such as online platforms, telephone interviews, or in-person interactions. By asking specific questions and collecting responses in a standardized format, researchers can quantify consumer opinions, preferences, and behaviors.
2. Experiments
Experiments are another essential type of quantitative marketing research. In experiments, researchers manipulate one or more variables to observe their effect on consumer behavior. This method allows for causal inference, helping businesses understand the impact of changes in product features, pricing strategies, or marketing tactics. Through controlled experiments, researchers can measure and analyze quantitative data to identify trends and patterns.
3. Observational studies
Observational studies involve systematically observing and recording consumer behavior in real-life settings. Researchers may use techniques such as tracking consumer purchases, monitoring website traffic, or analyzing social media interactions. By quantifying observational data, businesses can gain insights into consumer habits, trends, and preferences without direct intervention. Observational studies provide valuable quantitative data that complement findings from surveys and experiments, offering a comprehensive understanding of the market landscape.
Overall, these common types of quantitative market research enable businesses to gather, analyze, and interpret numerical data to make informed decisions and drive success in the marketplace. Each method offers unique advantages and insights, contributing to a robust understanding of consumer behavior and market dynamics.
Quantitative vs. Qualitative Market Research

Quantitative market research and qualitative market research are two distinct approaches used to gather and analyze data about consumer behavior and preferences. Here’s a breakdown of their key differences:
Data Collection Methods
- Quantitative Research: Utilizes structured methods such as surveys, experiments, and observational studies to gather numerical data from a large sample size. The focus is on quantifiable information, allowing for statistical analysis and measurement of trends and patterns.
- Qualitative Research: Relies on unstructured or semi-structured techniques like interviews, focus groups, and observations to gather in-depth insights into consumer attitudes, motivations, and perceptions. It emphasizes open-ended questions and discussions to explore nuances and uncover underlying reasons behind behaviors.
Data Analysis Techniques
- Quantitative Research: Involves the use of statistical tools and techniques to analyze numerical data systematically. Researchers employ methods such as regression analysis, correlation, and hypothesis testing to identify relationships, trends, and statistical significance.
- Qualitative Research: Focuses on interpreting non-numerical data through thematic analysis, content analysis, or grounded theory. Researchers analyze textual or visual data to identify themes, patterns, and emerging concepts, providing rich, descriptive insights into consumer experiences and perspectives.
3. Scope and Generalizability
- Quantitative Research: Offers the advantage of scalability and generalizability, allowing findings to be applied to a broader population. With a large and representative sample size, researchers can draw statistically valid conclusions and make predictions about market trends and consumer behavior.
- Qualitative Research: Emphasizes depth over breadth, providing detailed insights into specific contexts or segments of the target market. While findings may not be statistically generalizable, qualitative research offers rich, contextual understanding that can inform product development, marketing strategies, and decision-making.
4. Objective and Purpose
- Quantitative Research: Often used to quantify phenomena, measure market trends, evaluate product performance, or assess customer satisfaction through numerical metrics. It aims to provide precise, quantifiable data to support strategic decision-making and hypothesis testing.
- Qualitative Research: Focuses on exploring perceptions, attitudes, and motivations behind consumer behavior, uncovering underlying emotions and motivations. It is valuable for generating hypotheses, uncovering emerging trends, and gaining deeper insights into consumer needs and preferences.
In summary, quantitative market research focuses on numerical data collection and statistical analysis to quantify market phenomena and trends, while qualitative market research delves into the subjective experiences and perceptions of consumers through in-depth exploration and interpretation of non-numerical data. Both approaches offer valuable insights and have unique strengths, often complementing each other in comprehensive market research strategies.
Top Advantages of Quantitative Market Research

Quantitative market research offers numerous advantages for businesses seeking to understand their target market, make informed decisions, and stay ahead of the competition. Here are some of the top advantages:
1. Statistical Validity
Quantitative research allows for the collection of numerical data that can be analyzed statistically. This statistical analysis provides a level of validity and reliability to the findings, enabling businesses to make confident decisions based on concrete evidence rather than intuition or anecdotal evidence.
2. Large Sample Sizes
One of the key strengths of quantitative research is its ability to gather data from large sample sizes. This ensures that the findings are representative of the broader population, providing a comprehensive understanding of market trends, preferences, and behaviors.
3. Generalizability
With its focus on numerical data and large sample sizes, Quantitative market research results are often generalizable to a larger population. This means that insights drawn from the research can be applied to a wider audience, helping businesses make strategic decisions that resonate with their target market.
4. Measurable Insights
Quantitative research allows businesses to measure various aspects of consumer behavior, such as purchasing habits, brand loyalty, and product preferences. These measurable insights provide actionable data points that can inform marketing strategies, product development, and overall business planning.
5. Comparative Analysis
Quantitative market research enables businesses to conduct comparative analysis across different demographic groups, geographic regions, or time periods. By comparing data sets, businesses can identify trends, patterns, and correlations, helping them understand how various factors impact consumer behavior and market dynamics.
6. Predictive Modeling
Quantitative research often involves the use of advanced statistical techniques and predictive modeling. By analyzing historical data and identifying patterns, businesses can forecast future market trends, anticipate consumer demands, and proactively adjust their strategies to stay ahead of the competition.
7. Cost-Effective Data Collection
While quantitative research may require initial investment in survey development and data analysis tools, it is generally more cost-effective than qualitative research methods such as focus groups or in-depth interviews. Online surveys and data collection platforms make it easier and more affordable to gather large volumes of data from diverse respondents.
8. Data-driven Decision Making
In today’s data-driven business landscape, Quantitative market research plays a crucial role in informed decision-making. By leveraging data analytics and empirical evidence, businesses can make strategic decisions based on real-world data rather than gut feelings or assumptions, leading to more successful outcomes and sustainable growth.
Disadvantages of Quantitative Marketing Research

While quantitative market research offers numerous advantages, it’s also important to recognize its limitations and potential drawbacks. Here are some disadvantages of quantitative marketing research:
1. Limited Depth of Understanding
Quantitative research often focuses on numerical data and standardized survey instruments, which may limit the depth of understanding compared to qualitative research methods such as interviews or focus groups. It may not capture the richness of consumer experiences, emotions, or underlying motivations behind their behavior.
Quantitative research often involves surveying a large number of respondents, which provides a representative sample of the target population. The large sample size enhances the reliability and generalizability of the findings, allowing businesses to make informed decisions with confidence.
3. Inability to Explore Complex Issues
Quantitative market research research is well-suited for exploring straightforward questions and measuring predefined variables. However, it may struggle to address complex or nuanced issues that require in-depth exploration and qualitative insights. Complex phenomena often cannot be fully captured or understood through quantitative measures alone.
4. Lack of Contextual Understanding
Quantitative market research provides numerical data without always providing context or meaning behind the numbers. Without a deeper understanding of the context in which data was collected, businesses may misinterpret findings or overlook important insights. Contextual understanding is essential for making informed decisions based on quantitative research findings.
5. Difficulty in Capturing Unforeseen Variables
Quantitative research relies on predetermined survey questions and predefined variables, which may overlook unforeseen variables or emerging trends that could influence consumer behavior. This limitation can result in incomplete or outdated insights, particularly in fast-changing industries or markets.
Key Steps for Quantitative Marketing Research

Conducting quantitative market research involves several key steps to ensure the collection of reliable data and the generation of actionable insights. Here are the steps for conducting quantitative marketing research:
Define Research Objectives
Clearly define the research objectives and goals. Determine what specific information you want to gather, what questions you need to answer, and how you plan to use the research findings to inform business decisions.
Identify Target Population
Identify the target population or the group of individuals you want to survey. Define the characteristics of your target audience, such as demographics (age, gender, income), geographic location, behavior patterns, or other relevant criteria.
Develop Research Instrument
Design the survey instrument or questionnaire to collect quantitative data. Craft clear, concise, and unbiased questions that address your research objectives. Consider using a mix of closed-ended (e.g., multiple-choice, rating scales) and open-ended questions to gather both quantitative and qualitative insights.
Select Sampling Method
Choose an appropriate sampling method to select participants from the target population. Common sampling methods include random sampling, stratified sampling, cluster sampling, or convenience sampling. Ensure that your sample size is sufficient to achieve statistical significance and representativeness.
Data Collection
Administer the survey to the selected participants using appropriate data collection methods. This may include online surveys, telephone interviews, face-to-face interviews, or mail surveys, depending on the characteristics of your target population and the research objectives.
Ensure Data Quality
Implement measures to ensure the quality and validity of the collected data. This includes pretesting the survey instrument to identify any issues or ambiguities, monitoring data collection procedures to minimize errors, and verifying the accuracy of responses through data validation techniques.
Data Analysis
Analyze the collected data using statistical analysis techniques. This may involve descriptive statistics to summarize the data (e.g., mean, median, mode), inferential statistics to test hypotheses and make predictions (e.g., t-tests, regression analysis), and data visualization techniques to present findings effectively (e.g., charts, graphs, tables).
Interpret Findings
Interpret the findings of the data analysis in relation to the research objectives. Identify key trends, patterns, correlations, and insights that emerge from the data. Consider how the findings align with the research objectives and what implications they have for decision-making.
Draw Conclusions
Draw conclusions based on the interpreted findings and assess their implications for the business. Determine whether the research objectives have been met and what actionable insights can be derived from the findings. Consider any limitations or caveats associated with the research findings.
Report and Present Findings
Prepare a comprehensive research report that summarizes the methodology, findings, conclusions, and recommendations of the quantitative market research. Present the findings to relevant stakeholders in a clear and engaging manner, using visual aids and storytelling techniques to enhance understanding and facilitate decision-making.
By following these steps, businesses can conduct effective quantitative marketing research to gain valuable insights into their target market, make informed decisions, and achieve strategic objectives.
10 Best Practices for Quantitative Market Research

Quantitative research finds wide-ranging applications across various domains and industries due to its ability to provide systematic, numerical insights into market dynamics, consumer behavior, and business performance. Some key applications of quantitative research include:
1. Clearly Define Objectives
Start by clearly defining the research objectives and goals. Understand what specific information you need to gather and how you plan to use the research findings to inform decision-making.
2. Use Validated Measures
Utilize validated measurement tools and standardized survey instruments to ensure the reliability and validity of your data. Choose established scales and question formats that have been tested and proven to produce accurate results.
3. Pretest Survey Instrument
Before launching the survey, pretest the survey instrument with a small sample of respondents to identify any issues or ambiguities. This allows you to refine the questionnaire, improve question clarity, and ensure that respondents interpret questions as intended.
4. Ensure Representative Sampling
For quantitative market research, use appropriate sampling methods to ensure that your sample is representative of the target population. Consider factors such as demographics, geographic location, and behavior patterns when selecting participants to minimize sampling bias.
5. Maximize Response Rate
Implement strategies to maximize the response rate and minimize non-response bias. This may include personalized invitations, clear instructions, incentives for participation, and multiple reminders to encourage survey completion.
6. Maintain Data Quality
Implement measures to maintain data quality throughout the research process. This includes monitoring data collection procedures, verifying the accuracy of responses, and conducting data validation checks to identify and address errors.
7. Analyze Data Rigorously
Conduct rigorous data analysis using appropriate statistical techniques. Ensure that the analysis is conducted accurately and transparently, and interpret the findings in relation to the research objectives.
8. Consider Contextual Factors
Consider contextual factors that may influence the interpretation of research findings, such as market trends, competitive landscape, and consumer preferences. Contextual understanding helps provide a deeper understanding of the data and its implications.
9. Provide Actionable Insights
Focus on providing actionable insights that can inform decision-making and drive business outcomes. Present the findings in a clear, concise manner, and highlight key trends, patterns, and recommendations that stakeholders can act upon.
10. Continuously Improve
Continuously evaluate and improve your quantitative research processes based on feedback and learnings from each study. Incorporate lessons learned into future research initiatives to enhance the effectiveness and reliability of your market research efforts.
Quantitative Data Collection Methods for Marketing Research

Quantitative market research relies on various data collection methods to gather numerical data and statistical insights about consumer behavior, preferences, and trends. Here are some commonly used quantitative data collection methods for marketing research:
Online Surveys
Online surveys are one of the most popular methods for quantitative data collection in marketing research. Surveys are distributed electronically via email, websites, or social media platforms, allowing respondents to provide feedback on their preferences, purchasing habits, brand perceptions, and more. Online surveys offer the advantages of cost-effectiveness, wide reach, and the ability to collect large volumes of data quickly.
Telephone Surveys
Telephone surveys involve conducting interviews with respondents over the phone to gather quantitative data. Trained interviewers follow a standardized script and ask respondents a series of structured questions. Telephone surveys are useful for reaching diverse populations, including those without internet access, and can provide immediate feedback from respondents.
Face-to-Face Interviews
Face-to-face interviews involve direct interaction between interviewers and respondents in person. Interviewers use structured questionnaires to collect quantitative data on topics such as product preferences, satisfaction levels, and brand perceptions. Face-to-face interviews allow for deeper probing and clarification of responses but can be more time-consuming and expensive compared to other methods.
Mail Surveys
Mail surveys involve sending questionnaires to respondents via postal mail and asking them to complete and return the surveys by mail. While less common in the digital age, mail surveys can still be effective for reaching certain demographic groups, particularly older or rural populations. However, they tend to have lower response rates and longer turnaround times compared to online or telephone surveys.
Mobile Surveys
With the widespread use of smartphones and mobile devices, mobile surveys have become increasingly popular for quantitative data collection. Mobile surveys are designed to be mobile-friendly, allowing respondents to complete surveys on their smartphones or tablets at their convenience. Mobile surveys offer the advantages of accessibility, real-time data collection, and the ability to capture location-based information.
Point-of-Sale (POS) Data Collection
POS data collection involves capturing transactional data from point-of-sale systems used in retail stores, e-commerce platforms, and other sales channels. POS data provides quantitative insights into consumer purchasing behavior, including sales volumes, product preferences, pricing strategies, and seasonal trends. POS data collection is valuable for analyzing market trends, monitoring sales performance, and optimizing marketing strategies.
Website Analytics
Website analytics tools track and analyze quantitative data about website visitors’ behavior, interactions, and engagement metrics. These tools provide insights into website traffic, user demographics, conversion rates, bounce rates, and other key performance indicators (KPIs). Website analytics help marketers understand how visitors navigate their websites, identify areas for improvement, and optimize digital marketing efforts.
Social Media Monitoring
Social media monitoring tools collect quantitative data from social media platforms, such as Facebook, Twitter, Instagram, and LinkedIn. These tools track metrics such as follower counts, likes, shares, comments, and sentiment analysis to gauge brand awareness, customer engagement, and social media ROI. Social media monitoring provides valuable insights into consumer conversations, trends, and competitive intelligence in real-time.
In conclusion, quantitative market research is like a reliable guidebook for understanding how consumers behave and what’s happening in the market. It uses numbers and straightforward analysis to uncover insights that help businesses make smart decisions and plan for the future. By carefully collecting and studying data, companies can get a clear picture of who their customers are and what they want, which guides everything from product development to marketing strategies. Essentially, quantitative research helps businesses stay on track and ahead of the competition by giving them the knowledge they need to navigate the twists and turns of the market.
In today’s fast-paced business world, quantitative marketing research is essential for companies looking to understand what’s going on with their customers and in their industry. It’s like having a map that shows you where to go and how to get there. By using simple tools and techniques to analyze data, businesses can spot trends, predict what’s coming next, and make decisions with confidence.
Read more –
The 10 Best Keyword Research Services in 2024
B2B Market Research Services: A Comprehensive Overview
1. What is quantitative markeing research?
Quantitative marketing research involves collecting and analyzing numerical data to understand market trends, consumer behavior, and preferences. It employs structured surveys, polls, and statistical methods to quantify insights, providing measurable data for making informed business decisions and assessing market opportunities.
2. Is market research qualitative or quantitative?
Market research can be both qualitative and quantitative, depending on the type of data collected and analyzed. Quantitative research uses numerical data and statistical methods, while qualitative research uses non-numerical data and interpretive methods.
3.What are examples of the most common quantitative marketing research
Examples of common quantitative marketing research include surveys, experiments, observational studies, and data analysis techniques such as regression analysis and factor analysis.
4. How qualitative research can be useful in marketing?
Qualitative research can be useful in marketing for various purposes, such as exploring new product ideas, testing concepts, understanding customer satisfaction and loyalty, identifying market segments and personas, developing brand positioning and messaging, and generating creative solutions.
5. How to analyze quanitative data for marketing research?
To analyze qualitative data for marketing research, start by transcribing or summarizing the data. Then, use thematic analysis or coding techniques to identify recurring themes, patterns, and insights. Interpret these findings within the context of the research objectives to inform marketing strategies effectively.
6. How to conduct qualitative market research?
Qualitative market research can be conducted by using different methods and techniques, such as focus groups, in-depth interviews, observation, ethnography, case studies, and online communities. The choice of method depends on the research objectives, questions, budget, and time constraints.
7. What are some common quantitative market research techniques?
Common techniques include online surveys, telephone interviews, face-to-face interviews, mail surveys, and statistical analysis using software. These methods help gather numerical data and analyze consumer behavior and market trends.
8. How can businesses benefit from quantitative market research services?
Businesses gain expertise in designing robust methodologies, collecting high-quality data, and gaining insights into consumer preferences and market trends. This enables data-driven decision-making and staying competitive.
Case Studies

Building Brands Online- A Case Study of Ossisto’s E-commerce Website Development for Patissiers

Healthcare Efficiency – A Case Study with Ossisto’s Administrative Support

Enhancing Healthcare Efficiency with Ossisto Administrative Support – A Case study

Lokation Real Estate’s Journey to Success with Ossisto – Case study

Real Estate Success – A Case Study of Kings Homes & Associates with Ossisto’s Virtual…

Kaizen Karate Success Story – A Case Study of Kaizen Karate with Ossisto’s Virtual Assistance

Empowering Cornerstone Engineering LLC’s Growth with Ossisto’s Integrated Virtual Assistance Solutions

From Job Seeker to Trailblazer- A Success Story with Ossisto’s Strategic Job Search Support

How Ossisto’s Business Support Transformed a Cybersecurity Firm’s Operations: A Success Story

Ossisto’s Job Search Assistance Journey- A Case Study in Achievement
Start your free trial now, featured posts.

Optimizing Your Virtual Assistant Workflow for Increased Client Satisfaction

Top Benefits of Outsourcing Python Development for Your Business

Explore the Benefits of HubSpot White Label Services

Top 20 – Best Cloud Migration Service Providers in USA 2024

Outsource PHP Development in 2024 – A Step-by-Step Guide

10 Best Offshore Development Companies to Elevate Your Business

10 Best Criteria Of Online Business Startup CPA

Why Your Business Needs Offshore IT Outsourcing

Top 15 DevOps Consulting Companies in 2024

Top Cloud Migration Consulting Companies of 2024

Best Practices to Hire Frontend Developers

Offshore WordPress Development – Top 10 Benefits Explained

Top 15 Companies Providing Monthly Bookkeeping Services

How Virtual Assistants Can Simplify Student’s Lives

Content Moderation Services – Top Companies, Benefits and Tools

What Are Website Management Services? A Complete Overview

Cold Calling Virtual Assistant – Generate Leads with Benefits

10 Best Remote Bookkeeping Companies for Startups in 2024

How Outsourcing Your Controller Services Can Boost Your Business

Corporate Travel Planner – Why Your Business Needs One
Sign up for two hours free trial.

98 Quantitative Research Questions & Examples

As researchers, we know how powerful quantitative research data can be in helping answer strategic questions. Here, I’ve detailed 23 use cases and curated 98 quantitative market research questions with examples – making this a post you should add to your bookmark list , so you can quickly refer back.
I’ve formatted this post to show you 10-15 questions for each use case. At the end of each section, I also share a quicker way to get similar insights using modern market research tools like Similarweb.
What is a quantitative research question?
Quantitative market research questions tell you the what, how, when, and where of a subject. From trendspotting to identifying patterns or establishing averages– using quantitative data is a clear and effective way to start solving business problems.
Types of quantitative research questions
Quantitative market research questions are divided into two main types: descriptive and causal.
- Descriptive research questions seek to quantify a phenomenon by focusing on a certain population or phenomenon to measure certain aspects of it, such as frequency, average, or relationship.
- Causal research questions explore the cause-and-effect relationship between two or more variables.
The ultimate list of questions for quantitative market research
Get clear explanations of the different applications and approaches to quantitative research–with the added bonus of seeing what questions to ask and how they can impact your business.
Examples of quantitative research questions for competitive analysis
A powerful example of quantitative research in play is when it’s used to inform a competitive analysis . A process that’s used to analyze and understand how industry leaders and companies of interest are performing.
Pro Tip: Collect data systematically, and use a competitive analysis framework to record your findings. You can refer back to it when you repeat the process later in the year.
- What is the market share of our major competitors?
- What is the average purchase price of our competitors’ products?
- How often do our competitors release new products?
- What is the total number of customer reviews for our competitors’ products?
- What is the average rating of our competitors’ products?
- What is the average customer satisfaction score for our competitors?
- What is the average return rate of our competitors’ products?
- What is the average shipping time for our competitors’ products?
- What is the average price discount offered by our competitors?
- What is the average lifespan of our competitors’ products?
With this data, you can determine your position in the market and benchmark your performance against rival companies. It can then be used to improve offerings, service standards, pricing, positioning, and operational effectiveness. Notice that all questions can be answered with a numerical response , a key component of all successful examples of quantitative market research questions.
Quantitative research question example: market analysis
♀️ Question: What is the market share of our major competitors?
Insight sought: Industry market share of leaders and key competitors.
Challenges with traditional quantitative research methods: Outdated data is a major consideration; data freshness remains critical, yet is often tricky to obtain using traditional research methods. Markets shift fast, so being able to obtain and track market share in real time is a challenge many face.
A new approach: Similarweb enables you to track this key business KPI in real-time using digital data directly from the platform. On any day, you can see what your market share is, along with any players in your market. Plus, you get to see rising stars showing significant growth, who may pose a threat through market disruption or new tactics.
⏰ Time to insight: 30 seconds
✅ How it’s done: Using Similarweb’s Web Industry Analysis, two digital metrics give you the intel needed to decipher the market share in any industry. I’m using the Banking, Credit, and Lending market throughout these examples. I’ve selected the US market, analyzing the performance of the previous 3 months.
- Share of visits

Here, I can see the top players in my market based on the number of unique visitors to their sites. On top of the raw data that shows me the volume of visitors as a figure, I can quickly see the two players ( Capital One and Chase ) that have grown and by what percentage. On the side, you can see rising players in the industry. Now, while my initial question was to establish the market share of my major competitors, I can see there are a few disruptive players in my market who I’d want to track too; Synchrony.com being one of particular interest, given their substantial growth and traffic numbers.
- Share of search

Viewing the overall market size based on total search volumes, you can explore industry leaders in more detail. The top websites are the top five players, ranking by traffic share . You can also view the month-over-month change in visits, which shows you who is performing best at any given time . It’s the same five names, with Paypal and Chase leading the pack. However, I see Wells Fargo is better at attracting repeat visitors, while Capital One and Bank of America perform better at drawing in unique visitors.
In answer to my question, what is the market share of my major competitors, I can quickly use Similarweb’s quantitative data to get my answer.

This traffic share visual can be downloaded from the platform. It plots the ten industry leader’s market share and allocates the remaining share to the rest of the market.

I can also download a market quadrant analysis, which takes two key data points, traffic share and unique visitors, and plots the industry leaders. All supporting raw data can be downloaded in .xls format or connected to other business intelligence platforms via the API.
Quantitative research questions for consumer behavior studies
These studies measure and analyze consumer behavior, preferences, and habits . Any type of audience analysis helps companies better understand customer intent, and adjust offerings, messaging, campaigns, SEO, and ultimately offer more relevant products and services within a market.
- What is the average amount consumers spend on a certain product each month?
- What percentage of consumers are likely to purchase a product based on its price?
- How do the demographics of the target audience affect their purchasing behavior?
- What type of incentive is most likely to increase the likelihood of purchase?
- How does the store’s location impact product sales and turnover?
- What are the key drivers of product loyalty among consumers?
- What are the most commonly cited reasons for not buying a product?
- How does the availability of product information impact purchasing decisions?
- What is the average time consumers spend researching a product before buying it?
- How often do consumers use social media when making a purchase decision?
While applying a qualitative approach to such studies is also possible, it’s a great example of quantitative market research in action. For larger corporations, studies that involve a large, relevant sample size of a target market deliver vital consumer insights at scale .
Read More: 83 Qualitative Research Questions & Examples
Quantitative research question and answer: content strategy and analysis
♀️ Question: What type of content performed best in the market this past month?
Insight sought: Establish high-performing campaigns and promotions in a market.
Challenges with traditional quantitative research methods: Whether you consider putting together a panel yourself, or paying a company to do it for you, quantitative research at scale is costly and time-consuming. What’s more, you have to ensure that sampling is done right and represents your target audience.
A new approach: Data analysis is the foundation of our entire business. For over 10 years, Similarweb has developed a unique , multi-dimensional approach to understanding the digital world. To see the specific campaigns that resonate most with a target audience, use Similarweb’s Popular Pages feature. Key metrics show which campaigns achieve the best results for any site (including rival firms), campaign take-up, and periodic changes in performance and interest.
✅ How it’s done: I’ve chosen Capital One and Wells Fargo to review. Using the Popular Pages campaign filter, I can view all pages identified by a URL parameter UTM. For clarity, I’ve highlighted specific campaigns showing high-growth and increasing popularity. I can view any site’s trending, new, or best-performing pages using a different filter.

In this example, I have highlighted three campaigns showing healthy growth, covering teen checking accounts, performance savings accounts, and add-cash-in-store. Next, I will perform the same check for another key competitor in my market.

Here, I can see financial health tools campaigns with over 300% month-over-month growth and smarter credit and FICO campaigns showing strong performance. This tells me that campaigns focussing on education and tools are growing in popularity within this market.
Examples of quantitative research questions for brand tracking
These studies are designed to measure customers’ awareness, perceptions, behaviors, and attitudes toward a brand over time. Different applications include measuring brand awareness , brand equity, customer satisfaction, and purchase or usage intent.
These types of research surveys ask questions about brand knowledge, brand attributes, brand perceptions, and brand loyalty . The data collected can then be used to understand the current state of a brand’s performance, identify improvements, and track the success of marketing initiatives.
- To what extent is Brand Z associated with innovation?
- How do consumers rate the quality of Brand Z’s products and services?
- How has the awareness of Brand Z changed over the past 6 months?
- How does Brand Z compare to its competitors in terms of customer satisfaction?
- To what extent do consumers trust Brand Z?
- How likely are consumers to recommend Brand Z?
- What factors influence consumers’ purchase decisions when considering Brand Z?
- What is the average customer satisfaction score for equity?
- How does equity’s customer service compare to its competitors?
- How do customer perceptions of equity’s brand values compare to its competitors?
Quantitative research question example and answer: brand tracking
♀️ Question: How has the awareness of Brand Z changed over the past 6 months?
Insight sought: How has brand awareness changed for my business and competitors over time.
⏰ Time to insight: 2 minutes
✅ How it’s done: Using Similarweb’s search overview, I can quickly identify which brands in my chosen market have the highest brand awareness over any time period or location. I can view these stats as a custom market or examine brands individually.

Here, I’ve chosen a custom view that shows me five companies side-by-side. In the top right-hand corner, under branded traffic, you get a quick snapshot of the share of website visits that were generated by branded keywords. A branded keyword is when a consumer types the brand name + a search term.
Below that, you will see the search traffic and engagement section. Here, I’ve filtered the results to show me branded traffic as a percentage of total traffic. Similarweb shows me how branded search volumes grow or decline monthly. Helping me answer the question of how brand awareness has changed over time.
Quantitative research questions for consumer ad testing
Another example of using quantitative research to impact change and improve results is ad testing. It measures the effectiveness of different advertising campaigns. It’s often known as A/B testing , where different visuals, content, calls-to-action, and design elements are experimented with to see which works best. It can show the impact of different ads on engagement and conversions.
A range of quantitative market research questions can be asked and analyzed to determine the optimal approach.
- How does changing the ad’s headline affect the number of people who click on the ad?
- How does varying the ad’s design affect its click-through rate?
- How does altering the ad’s call-to-action affect the number of conversions?
- How does adjusting the ad’s color scheme influence the number of people who view the ad?
- How does manipulating the ad’s text length affect the average amount of time a user spends on the landing page?
- How does changing the ad’s placement on the page affect the amount of money spent on the ad?
- How does varying the ad’s targeting parameters affect the number of impressions?
- How does altering the ad’s call-to-action language impact the click-through rate?
Quantitative question examples for social media monitoring
Quantitative market research can be applied to measure and analyze the impact of social media on a brand’s awareness, engagement, and reputation . By tracking key metrics such as the number of followers, impressions, and shares, brands can:
- Assess the success of their social media campaigns
- Understand what content resonates with customers
- Spot potential areas for improvement
- How often are people talking about our brand on social media channels?
- How many times has our brand been mentioned in the past month?
- What are the most popular topics related to our brand on social media?
- What is the sentiment associated with our brand across social media channels?
- How do our competitors compare in terms of social media presence?
- What is the average response time for customer inquiries on social media?
- What percentage of followers are actively engaging with our brand?
- What are the most popular hashtags associated with our brand?
- What types of content generate the most engagement on social media?
- How does our brand compare to our competitors in terms of reach and engagement on social media?
Example of quantitative research question and answer: social media monitoring
♀️ Question: How does our brand compare to our competitors in terms of reach and engagement on social media?
Insight sought: The social channels that most effectively drive traffic and engagement in my market
✅ How it’s done: Similarweb Digital Research Intelligence shows you a marketing channels overview at both an industry and market level. With it, you can view the most effective social media channels in any industry and drill down to compare social performance across a custom group of competitors or an individual company.
Here, I’ve taken the five closest rivals in my market and clicked to expand social media channel data. Wells Fargo and Bank of America have generated the highest traffic volume from social media, with over 6.6 million referrals this year. Next, I can see the exact percentage of traffic generated by each channel and its relative share of traffic for each competitor. This shows me the most effective channels are YouTube, Facebook, LinkedIn, and Reddit – in that order.

In 30-seconds, I’ve discovered the following:
- YouTube is the most popular social network in my market.
- Facebook and LinkedIn are the second and third most popular channels.
- Wells Fargo is my primary target for a more in-depth review, with the highest performance on the top two channels.
- Bank of America is outperforming all key players significantly on LinkedIn.
- American Express has found a high referral opportunity on Reddit that others have been unable to match.
Power-up Your Market Research with Similarweb Today
Examples of quantitative research questions for online polls
This is one of the oldest known uses of quantitative market research. It dates back to the 19th century when they were first used in America to try and predict the outcome of the presidential elections.

Polls are just short versions of surveys but provide a point-in-time perspective across a large group of people. You can add a poll to your website as a widget, to an email, or if you’ve got a budget to spend, you might use a company like YouGov to add questions to one of their online polls and distribute it to an audience en-masse.
- What is your annual income?
- In what age group do you fall?
- On average, how much do you spend on our products per month?
- How likely are you to recommend our products to others?
- How satisfied are you with our customer service?
- How likely are you to purchase our products in the future?
- On a scale of 1 to 10, how important is price when it comes to buying our products?
- How likely are you to use our products in the next six months?
- What other brands of products do you purchase?
- How would you rate our products compared to our competitors?
Quantitative research questions for eye tracking studies
These research studies measure how people look and respond to different websites or ad elements. It’s traditionally an example of quantitative research used by enterprise firms but is becoming more common in the SMB space due to easier access to such technologies.
- How much time do participants spend looking at each visual element of the product or ad?
- How does the order of presentation affect the impact of time spent looking at each visual element?
- How does the size of the visual elements affect the amount of time spent looking at them?
- What is the average time participants spend looking at the product or ad as a whole?
- What is the average number of fixations participants make when looking at the product or ad?
- Are there any visual elements that participants consistently ignore?
- How does the product’s design or advertising affect the average number of fixations?
- How do different types of participants (age, gender, etc.) interact with the product or ad differently?
- Is there a correlation between the amount of time spent looking at the product or ad and the participants’ purchase decision?
- How does the user’s experience with similar products or ads affect the amount of time spent looking at the current product or ad?
Quantitative question examples for customer segmentation
Segmentation is becoming more important as organizations large and small seek to offer more personalized experiences. Effective segmentation helps businesses understand their customer’s needs–which can result in more targeted marketing, increased conversions, higher levels of loyalty, and better brand awareness.

If you’re just starting to segment your market, and want to know the best quantitative research questions to ask to help you do this, here are 20 to choose from.
Examples of quantitative research questions to segment customers
- What is your age range?
- What is your annual household income?
- What is your preferred online shopping method?
- What is your occupation?
- What types of products do you typically purchase?
- Are you a frequent shopper?
- How often do you purchase products online?
- What is your typical budget for online purchases?
- What is your primary motivation for purchasing products online?
- What factors influence your decision to purchase a product online?
- What device do you use most often when shopping online?
- What type of product categories are you most interested in?
- Do you prefer to shop online for convenience or for a better price?
- What type of discounts or promotions do you look for when making online purchases?
- How do you prefer to receive notifications about product promotions or discounts?
- What type of payment methods do you prefer when shopping online?
- What methods do you use to compare different products and prices when shopping online?
- What type of customer service do you expect when shopping online?
- What type of product reviews do you consider when making online purchases?
- How do you prefer to interact with a brand when shopping online?
Examples of quantitative research questions for analyzing customer segments
- What is the average age of customers in each segment?
- How do spending habits vary across customer segments ?
- What is the average length of time customers spend in each segment?
- How does loyalty vary across customer segments?
- What is the average purchase size in each segment?
- What is the average frequency of purchases in each segment?
- What is the average customer lifetime value in each segment?
- How does customer satisfaction vary across customer segments?
- What is the average response rate to campaigns in each segment?
- How does customer engagement vary across customer segments?
These questions are ideal to ask once you’ve already defined your segments. We’ve written a useful post that covers the ins and outs of what market segmentation is and how to do it.
Additional applications of quantitative research questions
I’ve covered ten use cases for quantitative questions in detail. Still, there are other instances where you can put quantitative research to good use.
Product usage studies: Measure how customers use a product or service.
Preference testing: Testing of customer preferences for different products or services.
Sales analysis: Analysis of sales data to identify trends and patterns.
Distribution analysis: Analyzing distribution channels to determine the most efficient and effective way to reach customers.
Focus groups: Groups of consumers brought together to discuss and provide feedback on a particular product, service, or marketing campaign.
Consumer interviews: Conducted with customers to understand their behavior and preferences better.
Mystery shopping: Mystery shoppers are sent to stores to measure customer service levels and product availability.
Conjoint analysis: Analysis of how consumers value different attributes of a product or service.
Regression analysis: Statistical analysis used to identify relationships between different variables.
A/B testing: Testing two or more different versions of a product or service to determine which one performs better.
Brand equity studies: Measure, compare and analyze brand recognition, loyalty, and consumer perception.
Exit surveys: Collect numerical data to analyze employee experience and reasons for leaving, providing insight into how to improve the work environment and retain employees.
Price sensitivity testing: Measuring responses to different pricing models to find the optimal pricing model, and identify areas if and where discounts or incentives might be beneficial.
Quantitative market research survey examples
A recent GreenBook study shows that 89% of people in the market research industry use online surveys frequently–and for good reason. They’re quick and easy to set up, the cost is minimal, and they’re highly scalable too.

Questions are always formatted to provide close-ended answers that can be quantified. If you wish to collect free-text responses, this ventures into the realm of qualitative research . Here are a few examples.
Brand Loyalty Surveys: Companies use online surveys to measure customers’ loyalty to their brand. They include questions about how long an individual has been a customer, their overall satisfaction with the service or product, and the likelihood of them recommending the brand to others.
Customer Satisfaction Surveys: These surveys may include questions about the customer’s experience, their overall satisfaction, and the likelihood they will recommend a product or service to others.
Pricing Studies: This type of research reveals how customers value their products or services. These surveys may include questions about the customer’s willingness to pay for the product, the customer’s perception of the price and value, and their comparison of the price to other similar items.
Product/Service Usage Studies: These surveys measure how customers use their products or services. They can include questions about how often customers use a product, their preferred features, and overall satisfaction.
Here’s an example of a typical survey we’ve used when testing out potential features with groups of clients. After they’ve had the chance to use the feature for a period, we send a short survey, then use the feedback to determine the viability of the feature for future release.
Employee Experience Surveys: Another great example of quantitative data in action, and one we use at Similarweb to measure employee satisfaction. Many online platforms are available to help you conduct them; here, we use Culture AMP . The ability to manipulate the data, spot patterns or trends, then identify the core successes and development areas are astounding.

How to answer quantitative research questions with Similarweb
For the vast majority of applications I’ve covered in this post, there’s a more modern, quicker, and more efficient way to obtain similar insights online. Gone are the days when companies need to use expensive outdated data or pay hefty sums of money to market research firms to conduct broad studies to get the answers they need.
By this point, I hope you’ve seen how quick and easy it is to use Similarweb to do market research the modern way. But I’ve only scratched the surface of its capabilities.
Take two to watch this introductory video and see what else you can uncover.
Added bonus: Similarweb API
If you need to crunch large volumes of data and already use tools like Tableau or PowerBI, you can seamlessly connect Similarweb via the API and pipe in the data. So for faster analysis of big data, you can leverage Similarweb data to use alongside the visualization tools you already know and love.
Similarweb’s suite of market intelligence solutions offers unbiased, accurate, honest insights you can trust. With a world of data at your fingertips, use Similarweb Research Intelligence to uncover facts that help inform your research and strengthen your position.
Take a look at:
- Our Market Research suite
- Our Benchmarking tools
- Our Audience Insights tool
- Our Company Research module
- Our Consumer Journey Tracker
- Our Competitive Analysis Tool
Wrapping up
Today’s markets change at lightning speed. To keep up and succeed, companies need access to insights and intel they can depend on to be timely and on-point. While quantitative market research questions can and should always be asked, it’s important to leverage technology to increase your speed to insight, and thus improve reaction times and response to market shifts.
What is quantitative market research?
Quantitative market research is a form of research that uses numerical data to gain insights into the behavior and preferences of customers. It is used to measure and track the performance of products, services, and campaigns.
How does quantitative market research help businesses?
Quantitative market research can help businesses identify customer trends, measure customer satisfaction, and develop effective marketing strategies. It can also provide valuable insights into customer behavior, preferences, and attitudes.
What types of questions should be included in a quantitative market research survey?
Questions in a quantitative market research survey should be focused, clear, and specific. Questions should be structured to collect quantitative data, such as numbers, percentages, or frequency of responses.
What methods can be used to collect quantitative market research data?
Common methods used to collect quantitative market research data include surveys, interviews, focus groups, polls, and online questionnaires.
What are the advantages and disadvantages of using quantitative market research?
The advantages of using quantitative market research include the ability to collect data quickly, the ability to analyze data in a structured way, and the ability to identify trends. Disadvantages include the potential for bias, the cost of collecting data, and the difficulty in interpreting results.

by Liz March
Digital Research Specialist
Liz March has 15 years of experience in content creation. She enjoys the outdoors, F1, and reading, and is pursuing a BSc in Environmental Science.
Related Posts

Unlocking Consumer Behavior: What Makes Your Customers Tick?

Customer Segmentation: Expert Tips on Understanding Your Audience

Market Demand 101: How to Gauge Demand for Your Products

Data Quality and Its Importance: Examples, Benefits, and Best Practices

What Is Data Visualization? Your Complete Guide

What is Data-as-a-Service (DaaS), and Why Do You Need It?
Wondering what similarweb can do for your business.
Give it a try or talk to our insights team — don’t worry, it’s free!

Quantitative Marketing and Marketing Management
Marketing Models and Methods in Theory and Practice
- © 2012
- Adamantios Diamantopoulos 0 ,
- Wolfgang Fritz 1 ,
- Lutz Hildebrandt 2
Chair of International Marketing, University of Vienna, Vienna, Austria
You can also search for this editor in PubMed Google Scholar
Braunschweig, Germany
Berlin, germany.
- A broad overview of quantitative approaches in marketing
206k Accesses
77 Citations
3 Altmetric
This is a preview of subscription content, log in via an institution to check access.
Access this book
Subscribe and save.
- Get 10 units per month
- Download Article/Chapter or eBook
- 1 Unit = 1 Article or 1 Chapter
- Cancel anytime
- Available as PDF
- Read on any device
- Instant download
- Own it forever
- Compact, lightweight edition
- Dispatched in 3 to 5 business days
- Free shipping worldwide - see info
- Durable hardcover edition
Tax calculation will be finalised at checkout
Other ways to access
Licence this eBook for your library
Institutional subscriptions
About this book
Similar content being viewed by others.

The past, present, and future of measurement and methods in marketing analysis

Marketing Decision Models: Progress and Perspectives

Marketing and Market Research
- Empirische Marktmodellierung
- Festschrift
- Festschrift Udo Wagner
- Käuferverhalten
- Marketing-Management
- Marketing-Modelle
Table of contents (30 chapters)
Front matter, marketing models and marketing research methods, implementing the pareto/nbd model: a user-friendly approach.
- Albert C. Bemmaor, Nicolas Glady, Daniel Hoppe
The Consistency Adjustment Problem of AHP Pairwise Comparison Matrices
- Dominic Gastes, Wolfgang Gaul
Choice Modeling and SEM
- Lutz Hildebrandt, Dirk Temme, Marcel Paulssen
Using Multi-Informant Designs to Address Key Informant and Common Method Bias
- Christian Homburg, Martin Klarmann, Dirk Totzek
Using Artificial Neural Nets for Flexible Aggregate Market Response Modeling
- Harald Hruschka
Supporting Strategic Product Portfolio Planning by Market Simulation
- Karsten Kieckhäfer, Thomas Volling, Thomas Stefan Spengler
Knowledge Generation in Marketing
- Peter S. H. Leeflang, Alessandro M. Peluso
Implications of Linear Versus Dummy Coding for Pooling of Information in Hierarchical Models
- Thomas Otter, Tetyana Kosyakova
Visual Decision Making Styles and Geographical Information Systems
- Ana-Marija Ozimec, Martin Natter, Thomas Reutterer
Analyzing Sequences in Marketing Research
- Günter Silberer
DISE: Dynamic Intelligent Survey Engine
- Christian Schlereth, Bernd Skiera
Consumer Behavior and Retailing
The effect of attitude toward money on financial trouble and compulsive buying.
- András Bauer, Ariel Mitev
Repetitive Purchase Behavior
- Hans Baumgartner
Investigating Cross-Category Brand Loyal Purchase Behavior in FMCG
- Yasemin Boztuğ, Lutz Hildebrandt, Nadja Silberhorn
Validation of Brand Relationship Types Using Advanced Clustering Methods
- Wolfgang Fritz, Michael Kempe, Bettina Lorenz
Positioning Bases’ Influence on Product Similarity Perceptions
- Christoph Fuchs, Adamantios Diamantopoulos
The Influence of Location-Aware Mobile Marketing Messages on Consumers’ Buying Behavior
- Andrea Gröppel-Klein, Philipp Broeckelmann
Editors and Affiliations
Adamantios Diamantopoulos
Wolfgang Fritz
Lutz Hildebrandt
About the editors
Professor DDr. Adamantios Diamantopoulos, Holder of the Chair of International Marketing, University of Vienna, Austria. Professor Dr. Wolfgang Fritz, Director of the Institute of Marketing, Technische Universität Braunschweig, Germany, and Honorary Professor, University of Vienna, Austria. Professor Dr. Lutz Hildebrandt, Director of the Institute of Marketing, Humboldt University of Berlin, Germany, and Honorary Professor, University of Vienna, Austria.
Bibliographic Information
Book Title : Quantitative Marketing and Marketing Management
Book Subtitle : Marketing Models and Methods in Theory and Practice
Editors : Adamantios Diamantopoulos, Wolfgang Fritz, Lutz Hildebrandt
DOI : https://doi.org/10.1007/978-3-8349-3722-3
Publisher : Gabler Verlag Wiesbaden
eBook Packages : Business and Economics , Business and Management (R0)
Copyright Information : Gabler Verlag | Springer Fachmedien Wiesbaden 2012
Hardcover ISBN : 978-3-8349-3060-6 Published: 12 July 2012
Softcover ISBN : 978-3-8349-4657-7 Published: 18 July 2014
eBook ISBN : 978-3-8349-3722-3 Published: 31 January 2013
Edition Number : 1
Number of Pages : V, 627
Topics : Marketing , Market Research/Competitive Intelligence
- Publish with us
Policies and ethics
- Find a journal
- Track your research
9 Best Marketing Research Methods to Know Your Buyer Better [+ Examples]
Published: August 08, 2024
One of the most underrated skills you can have as a marketer is marketing research — which is great news for this unapologetic cyber sleuth.

From brand design and product development to buyer personas and competitive analysis, I’ve researched a number of initiatives in my decade-long marketing career.
And let me tell you: having the right marketing research methods in your toolbox is a must.
Market research is the secret to crafting a strategy that will truly help you accomplish your goals. The good news is there is no shortage of options.
How to Choose a Marketing Research Method
Thanks to the Internet, we have more marketing research (or market research) methods at our fingertips than ever, but they’re not all created equal. Let’s quickly go over how to choose the right one.
.png "quantitative research methods marketing")
Free Market Research Kit
5 Research and Planning Templates + a Free Guide on How to Use Them in Your Market Research
- SWOT Analysis Template
- Survey Template
- Focus Group Template
Download Free
All fields are required.
You're all set!
Click this link to access this resource at any time.
1. Identify your objective.
What are you researching? Do you need to understand your audience better? How about your competition? Or maybe you want to know more about your customer’s feelings about a specific product.
Before starting your research, take some time to identify precisely what you’re looking for. This could be a goal you want to reach, a problem you need to solve, or a question you need to answer.
For example, an objective may be as foundational as understanding your ideal customer better to create new buyer personas for your marketing agency (pause for flashbacks to my former life).
Or if you’re an organic sode company, it could be trying to learn what flavors people are craving.
2. Determine what type of data and research you need.
Next, determine what data type will best answer the problems or questions you identified. There are primarily two types: qualitative and quantitative. (Sound familiar, right?)
- Qualitative Data is non-numerical information, like subjective characteristics, opinions, and feelings. It’s pretty open to interpretation and descriptive, but it’s also harder to measure. This type of data can be collected through interviews, observations, and open-ended questions.
- Quantitative Data , on the other hand, is numerical information, such as quantities, sizes, amounts, or percentages. It’s measurable and usually pretty hard to argue with, coming from a reputable source. It can be derived through surveys, experiments, or statistical analysis.
Understanding the differences between qualitative and quantitative data will help you pinpoint which research methods will yield the desired results.
For instance, thinking of our earlier examples, qualitative data would usually be best suited for buyer personas, while quantitative data is more useful for the soda flavors.
However, truth be told, the two really work together.
Qualitative conclusions are usually drawn from quantitative, numerical data. So, you’ll likely need both to get the complete picture of your subject.
For example, if your quantitative data says 70% of people are Team Black and only 30% are Team Green — Shout out to my fellow House of the Dragon fans — your qualitative data will say people support Black more than Green.
(As they should.)
Primary Research vs Secondary Research
You’ll also want to understand the difference between primary and secondary research.
Primary research involves collecting new, original data directly from the source (say, your target market). In other words, it’s information gathered first-hand that wasn’t found elsewhere.
Some examples include conducting experiments, surveys, interviews, observations, or focus groups.
Meanwhile, secondary research is the analysis and interpretation of existing data collected from others. Think of this like what we used to do for school projects: We would read a book, scour the internet, or pull insights from others to work from.
So, which is better?
Personally, I say any research is good research, but if you have the time and resources, primary research is hard to top. With it, you don’t have to worry about your source's credibility or how relevant it is to your specific objective.
You are in full control and best equipped to get the reliable information you need.
3. Put it all together.
Once you know your objective and what kind of data you want, you’re ready to select your marketing research method.
For instance, let’s say you’re a restaurant trying to see how attendees felt about the Speed Dating event you hosted last week.
You shouldn’t run a field experiment or download a third-party report on speed dating events; those would be useless to you. You need to conduct a survey that allows you to ask pointed questions about the event.
This would yield both qualitative and quantitative data you can use to improve and bring together more love birds next time around.
Best Market Research Methods for 2024
Now that you know what you’re looking for in a marketing research method, let’s dive into the best options.
Note: According to HubSpot’s 2024 State of Marketing report, understanding customers and their needs is one of the biggest challenges facing marketers today. The options we discuss are great consumer research methodologies , but they can also be used for other areas.
Primary Research
1. interviews.
Interviews are a form of primary research where you ask people specific questions about a topic or theme. They typically deliver qualitative information.
I’ve conducted many interviews for marketing purposes, but I’ve also done many for journalistic purposes, like this profile on comedian Zarna Garg . There’s no better way to gather candid, open-ended insights in my book, but that doesn’t mean they’re a cure-all.
What I like: Real-time conversations allow you to ask different questions if you’re not getting the information you need. They also push interviewees to respond quickly, which can result in more authentic answers.
What I dislike: They can be time-consuming and harder to measure (read: get quantitative data) unless you ask pointed yes or no questions.
Best for: Creating buyer personas or getting feedback on customer experience, a product, or content.
2. Focus Groups
Focus groups are similar to conducting interviews but on a larger scale.
In marketing and business, this typically means getting a small group together in a room (or Zoom), asking them questions about various topics you are researching. You record and/or observe their responses to then take action.
They are ideal for collecting long-form, open-ended feedback, and subjective opinions.
One well-known focus group you may remember was run by Domino’s Pizza in 2009 .
After poor ratings and dropping over $100 million in revenue, the brand conducted focus groups with real customers to learn where they could have done better.
It was met with comments like “worst excuse for pizza I’ve ever had” and “the crust tastes like cardboard.” But rather than running from the tough love, it took the hit and completely overhauled its recipes.
The team admitted their missteps and returned to the market with better food and a campaign detailing their “Pizza Turn Around.”
The result? The brand won a ton of praise for its willingness to take feedback, efforts to do right by its consumers, and clever campaign. But, most importantly, revenue for Domino’s rose by 14.3% over the previous year.
The brand continues to conduct focus groups and share real footage from them in its promotion:
What I like: Similar to interviewing, you can dig deeper and pivot as needed due to the real-time nature. They’re personal and detailed.
What I dislike: Once again, they can be time-consuming and make it difficult to get quantitative data. There is also a chance some participants may overshadow others.
Best for: Product research or development
Pro tip: Need help planning your focus group? Our free Market Research Kit includes a handy template to start organizing your thoughts in addition to a SWOT Analysis Template, Survey Template, Focus Group Template, Presentation Template, Five Forces Industry Analysis Template, and an instructional guide for all of them. Download yours here now.
3. Surveys or Polls
Surveys are a form of primary research where individuals are asked a collection of questions. It can take many different forms.
They could be in person, over the phone or video call, by email, via an online form, or even on social media. Questions can be also open-ended or closed to deliver qualitative or quantitative information.
A great example of a close-ended survey is HubSpot’s annual State of Marketing .
In the State of Marketing, HubSpot asks marketing professionals from around the world a series of multiple-choice questions to gather data on the state of the marketing industry and to identify trends.
The survey covers various topics related to marketing strategies, tactics, tools, and challenges that marketers face. It aims to provide benchmarks to help you make informed decisions about your marketing.
It also helps us understand where our customers’ heads are so we can better evolve our products to meet their needs.
Apple is no stranger to surveys, either.
In 2011, the tech giant launched Apple Customer Pulse , which it described as “an online community of Apple product users who provide input on a variety of subjects and issues concerning Apple.”

"For example, we did a large voluntary survey of email subscribers and top readers a few years back."
While these readers gave us a long list of topics, formats, or content types they wanted to see, they sometimes engaged more with content types they didn’t select or favor as much on the surveys when we ran follow-up ‘in the wild’ tests, like A/B testing.”
Pepsi saw similar results when it ran its iconic field experiment, “The Pepsi Challenge” for the first time in 1975.
The beverage brand set up tables at malls, beaches, and other public locations and ran a blindfolded taste test. Shoppers were given two cups of soda, one containing Pepsi, the other Coca-Cola (Pepsi’s biggest competitor). They were then asked to taste both and report which they preferred.
People overwhelmingly preferred Pepsi, and the brand has repeated the experiment multiple times over the years to the same results.
What I like: It yields qualitative and quantitative data and can make for engaging marketing content, especially in the digital age.
What I dislike: It can be very time-consuming. And, if you’re not careful, there is a high risk for scientific error.
Best for: Product testing and competitive analysis
Pro tip: " Don’t make critical business decisions off of just one data set," advises Pamela Bump. "Use the survey, competitive intelligence, external data, or even a focus group to give you one layer of ideas or a short-list for improvements or solutions to test. Then gather your own fresh data to test in an experiment or trial and better refine your data-backed strategy."
Secondary Research
8. public domain or third-party research.
While original data is always a plus, there are plenty of external resources you can access online and even at a library when you’re limited on time or resources.
Some reputable resources you can use include:
- Pew Research Center
- McKinley Global Institute
- Relevant Global or Government Organizations (i.e United Nations or NASA)
It’s also smart to turn to reputable organizations that are specific to your industry or field. For instance, if you’re a gardening or landscaping company, you may want to pull statistics from the Environmental Protection Agency (EPA).
If you’re a digital marketing agency, you could look to Google Research or HubSpot Research . (Hey, I know them!)
What I like: You can save time on gathering data and spend more time on analyzing. You can also rest assured the data is from a source you trust.
What I dislike: You may not find data specific to your needs.
Best for: Companies under a time or resource crunch, adding factual support to content
Pro tip: Fellow HubSpotter Iskiev suggests using third-party data to inspire your original research. “Sometimes, I use public third-party data for ideas and inspiration. Once I have written my survey and gotten all my ideas out, I read similar reports from other sources and usually end up with useful additions for my own research.”
9. Buy Research
If the data you need isn’t available publicly and you can’t do your own market research, you can also buy some. There are many reputable analytics companies that offer subscriptions to access their data. Statista is one of my favorites, but there’s also Euromonitor , Mintel , and BCC Research .
What I like: Same as public domain research
What I dislike: You may not find data specific to your needs. It also adds to your expenses.
Best for: Companies under a time or resource crunch or adding factual support to content
Which marketing research method should you use?
You’re not going to like my answer, but “it depends.” The best marketing research method for you will depend on your objective and data needs, but also your budget and timeline.
My advice? Aim for a mix of quantitative and qualitative data. If you can do your own original research, awesome. But if not, don’t beat yourself up. Lean into free or low-cost tools . You could do primary research for qualitative data, then tap public sources for quantitative data. Or perhaps the reverse is best for you.
Whatever your marketing research method mix, take the time to think it through and ensure you’re left with information that will truly help you achieve your goals.
Don't forget to share this post!
Related articles.
![SWOT Analysis: How To Do One [With Template & Examples]](https://www.hubspot.com/hubfs/marketingplan_20.webp "quantitative research methods marketing")
SWOT Analysis: How To Do One [With Template & Examples]

28 Tools & Resources for Conducting Market Research

What is a Competitive Analysis — and How Do You Conduct One?

Market Research: A How-To Guide and Template

TAM, SAM & SOM: What Do They Mean & How Do You Calculate Them?
![How to Run a Competitor Analysis [Free Guide]](https://www.hubspot.com/hubfs/Google%20Drive%20Integration/how%20to%20do%20a%20competitor%20analysis_122022.jpeg "quantitative research methods marketing")
How to Run a Competitor Analysis [Free Guide]
![5 Challenges Marketers Face in Understanding Audiences [New Data + Market Researcher Tips]](https://www.hubspot.com/hubfs/challenges%20marketers%20face%20in%20understanding%20the%20customer%20.png "quantitative research methods marketing")
5 Challenges Marketers Face in Understanding Audiences [New Data + Market Researcher Tips]

Causal Research: The Complete Guide

Total Addressable Market (TAM): What It Is & How You Can Calculate It

What Is Market Share & How Do You Calculate It?
Free Guide & Templates to Help Your Market Research
Marketing software that helps you drive revenue, save time and resources, and measure and optimize your investments — all on one easy-to-use platform
Qualitative and Quantitative Marketing Research Methods

Some researchers take a hard approach to data, either falling squarely on the side of the numbers (quantitative data) or on the other side, one of focus groups and individual consumer feedback (qualitative data).
But the richest insights come from a paired approach to research, one that seeks both statistically significant findings to define our product’s place in the market as well as a deep understanding of how our product fits into a single consumer’s life.
Why do you need either of these types of research? Learning about your customers means that you can more efficiently answer their needs. A crystal-clear picture of who your consumer is and why they need your product allows you to not only refine your product but ideate even better solutions to your consumers’ problems.

Quantitative Methods

What Is Quantitative Research?
The most common quantitative research methods are customer surveys and questionnaires. If you have questions that drill down into specifics about your company, your market, or your target customer population, you’re looking for quantitative research. It answers questions like who, when, where, how many, how frequently? These are not general, exploratory questions; they’re questions looking for transactional, numerical data.
Why Do You Need Quantitative Research?
It will tell you:
- Whether customers are looking for or need a product like yours
- Who your target population should be and what convinces them to buy
- What, if anything, your target population knows about your market or your product
- If your target market’s attitude or perception is changing, which can give insights into how you should respond
How Do You Conduct Quantitative Research?
While the big two methods of gathering data are surveys and questionnaires, there are plenty of ways to conduct these methods.
When you only need a few questions answered and can’t justify the cost of rolling out a full-scale survey, an omnibus is a good solution. This style groups questions from multiple businesses into one survey so that the time and effort spent recruiting and compensating participants can be spread across several companies who have only a few questions.
Email or Snail Mail Surveys
Digital or printed surveys are the most common for a reason: They are extremely cost-effective because they are automated. Results roll in without needing a person to make a phone call or interact with every individual respondent. These are most effective when the questions are straightforward, like choosing A vs. B. They’re not so effective in nuanced preference questions, like describing how A vs B makes a participant feel.
Telephone Surveys
The human interaction of phone surveys can make a participant feel more engaged than a digital or printed survey, leading them to give more considered answers – this creates better data. Telephone surveys also allow the researcher to understand a participant’s answer more clearly based on their voice and tone. The statistical reliability of a survey over an interview also remains intact because the questions are consistent across participants. Telephone surveys are best:
- If the survey questions end with a “Why?” or “Can you explain?”
- If the survey questions are longer or slightly complicated and require better participant concentration than normal
- If you are pilot (or metric) testing your online survey questions before they are deployed widely online. “Why?” and “Can you explain?” phone questions can capture the most common answers, which can then be listed as checkbox options A, B, C, and D in the widely distributed online survey. This will discourage write-in answers, making your data easier to analyze.
Face-To-Face Surveys
A criticism of surveys, in general, is that they don’t allow for conversation or elaboration. While this is a benefit in keeping data consistent, it also leaves findings on the table that a researcher could have used to better understand the participant’s feedback. In face-to-face surveys, a researcher still can’t go off script, but they can make note of a scrunched nose when a product is mentioned or a disengaged stance. Face-to-face surveys are best when the survey questions delve into emotions. An example might be survey questions for emotionally charged products or campaigns , like Dove’s Campaign for Real Beauty. “How does marketing around women’s beauty products today make you feel?”
It’s easy for face-to-face surveys to become interviews, but keep in mind the difference is that surveys do not go off script. The survey researcher must stick to the order of the questions and the exact wording to keep statistical reliability, and in an interview, the researcher has control over the order, pacing, and structure of all questions.
Analyzing quantitative results is easier now with survey tools like SurveyMonkey, SurveyGizmo, and Qualtrics. But those tools won’t be able to remove outliers or include questions that will weed out people who didn’t understand the question and people who rushed through without reading. Those tools still require human manipulation to produce clean, statistically reliable data. This data can be analyzed through various different lenses, including segmentation and personas, to better understand the population who answered the survey and predict their behavior.
Quantitative findings can lead to the following findings and deliverables:
- Market segmentation
- Pricing projections
- Net promoter scores
- Customer satisfaction ratings
- Recommendations about a product launch, pricing, messaging
- Changes in sales efforts to increase customer satisfaction and target market segments
Qualitative Methods

What Is Qualitative Research?
Qualitative research is interested in finding the opinions, beliefs, and values of a target population. The most common forms of qualitative research are focus groups and interviews. While not usually statistically significant, qualitative research is valuable in putting a face to a number and answering questions like, “How?” “Why?” and “Would?” This style of research humanizes your consumer base, allowing more accurate predictions of customer behavior. Qualitative research can also identify problems and opportunities that a survey or questionnaire never would have identified. In qualitative research, we pose probing questions that aim to understand consumers as people. A few drawbacks of qualitative research are (A) results are always open to concern about researcher subjectivity, as results are not numerical and are based on conversations and (B) qualitative research can be time-consuming and expensive.
Why Do You Need Qualitative Research?
It will help you:
- Make human-centered decisions across the entire business, not just in the marketing department, leading to a better customer experience overall
- Understand context around quantitative data – like why bounce rates are so high off of one page on your site
- Predict how your product or service would fit in and impact the consumer’s life
- Understand the emotions your target population feels in relation to your product or market
- How do you conduct qualitative research?
Focus Groups
In focus groups, 6-10 people with something in common (like looking to buy a luxury car or having a baby) have a discussion moderated by a researcher. This style is best for exploring “what if”s, researching new concepts, and testing new product ideas. It helps let participants bounce ideas off of each other, spurring memories but also giving individuals time to think while others are talking. There’s less pressure on each participant to answer spontaneously, as in an interview. The drawback is that it’s very easy for a focus group to become derailed by one or two overpowering or disengaged participants.
Customer & Prospect Interviews
Interviews can come in many forms, but the base form is a one-on-one conversation. An interview is meant to find underlying beliefs from a key, representative consumer about some facet of your product or service. A skilled interviewer can recognize when a topic is unproductive versus when a tangent is worthwhile to understand the participant’s perspective.
Contextual Inquiry
In a contextual inquiry, a researcher trails the participant in the participant’s normal activities. Contextual inquiries happen “in the wild.” For example, a lunchbox company might observe a customer all day, from packing lunch in the morning to bringing home the empty box at night, to understand the lunchbox’s deficits, what products the participant uses in conjunction with the lunchbox (like Tupperware, silverware, etc), and ask questions.
One of the best ways to fully understand your audience and what’s important to them is through social listening. A social listening tool allows you to monitor and analyze online posts and comments based on an established keyword criterion. By doing this, a brand can analyze the demographics or their online audience, their purchase intent, what they see as the key product attributes, their feelings on your brand versus the competition, as well as category-level conversations.
An article in Harvard Business Review tells this useful story that came out of social listening “A large pharmaceutical company, for example, learned about an unsuspected customer challenge through a single photo on Flickr. The image showed a man wrapping a part of his leg in foil after applying a pain relief ointment. It turned out that the medication left untreatable stains on certain fabrics, hence the protective foil. Executives had been unaware of the problem despite years of conventional consumer research.”
Customer Experience Research
Interviews are common in customer experience research, from usability studies (analyzing how easy it is to use a product, usually a website) to customer journey research (asking a customer to describe their entire relationship with a product, from learning about it to purchase), and more. The basic idea always comes down to asking a consumer about their relationship with a company’s product or service, though.
Qualitative and Quantitative Research Working Together
Qualitative and quantitative research are not at odds; in fact, they inform and enrich one another. One doesn’t come before the other, either. Personal, individualized insights of qualitative research can help us understand the questions we should be asking of our mass market in quantitative research, but wider quantitative research can also help us understand where we need to drill down and ask more questions from just a few consumers. Actually, the best research comes from a cyclical application of both techniques, allowing us to regularly turn from a wide-lens view of our product and its value to a mass market, to a more narrowed scope, focusing on understanding the unique perspectives of just a few people who we impact.
We're Glad You're Here
Sign up for our monthly newsletter to receive updates.

5 Steps to Develop the Right Marketing KPIs
When it comes time to establish annual plans, marketers often struggle with how to choose the most appropriate KPIs.

High-Quality Content Crawled More Often – Here's How to Create It
Creating regular content for a brand is one of the most challenging aspects of digital marketing.

How to Measure Marketing ROI
The first step to creating effective marketing is to identify what your objectives are. It may seem simple, but as the world becomes more digitally...
Home • Knowledge hub • Choosing the Right Approach: Qualitative vs. Quantitative Market Research.
Choosing the Right Approach: Qualitative vs. Quantitative Market Research.

Imagine this scenario: you’re the Product Marketing Manager at Stellar Sneakers, a thriving company known for its innovative and stylish footwear. Your team is poised to launch a new line of eco-friendly shoes, but before you do, you want to gather valuable insights to ensure the product’s success. There’s a budget set aside for market research, but you’re faced with a crucial decision: should you go for a qualitative approach, diving into the deep and nuanced attitudes of your target audience? Or should you lean on quantitative research , capturing broad trends and measurable consumer preferences?
These choices are commonplace for marketing professionals. Market research is instrumental in developing successful products and campaigns, helping you understand your target audience, gauge customer preferences, and assess market trends. However, deciding between qualitative and quantitative methodologies can often seem like a labyrinth.
In this article, we will navigate this maze together. We’ll delve into the strengths and weaknesses of both qualitative and quantitative research, providing a practical guide for marketing executives like yourself wrestling with this choice. Our goal is to equip you with a more profound understanding, enabling you to select the most effective research methodology for your marketing objectives.
Understanding Qualitative Research
Qualitative research can be likened to a deep, exploratory dive. Instead of skimming the ocean’s surface to understand what lies beneath, qualitative research immerses itself in the depths to explore the unseen. In other words, it involves gathering subjective, non-numerical data to uncover your target audience’s thoughts, feelings, and motivations.
Imagine conducting in-depth interviews or focus groups with your prospective customers. You might ask them open-ended questions like, “How important is sustainability in your footwear choices?” or “What would make you choose our new eco-friendly shoes over traditional options?” Such questions do not restrict respondents to choosing from pre-determined answers; instead, they allow them to express their unique thoughts and emotions.
Similarly, other qualitative methods, like observations or ethnography, enable researchers to study people in their natural settings. For instance, observing customers in a retail store can offer valuable insights into shopping habits and behaviors that would be difficult to capture through structured surveys.
In a nutshell, qualitative research is all about understanding the “why” behind consumer behavior. It delves into the intricacies of consumer attitudes, beliefs, and experiences, providing a rich, nuanced understanding of your target audience. But like all methodologies, qualitative research has its strengths and drawbacks.
Pros of Qualitative Research
Now that we understand what qualitative research entails let’s dive into its advantages. For you, as the Product Marketing Manager of Stellar Sneakers, these pros can guide your understanding of what consumers feel and why they behave the way they do.
In-depth Understanding: The primary strength of qualitative research lies in its depth of understanding. By allowing consumers to express their thoughts and feelings in their own words, you can gain a holistic and nuanced understanding of their attitudes, beliefs, and experiences. You might discover, for example, that your target audience highly values sustainable practices not just because of environmental concerns but due to an underlying desire to contribute positively to society. This insight goes beyond basic preferences and can help guide your product development and marketing strategies.
Flexibility: Qualitative research is adaptable, allowing exploring unexpected avenues that emerge during the research process. Let’s say during your focus group discussions, a participant brings up an unanticipated point about the aesthetics of eco-friendly shoes. This can lead the conversation down a new path, offering insights you hadn’t considered initially. This adaptability makes qualitative research a powerful tool for discovery.
Contextual Understanding: This research method provides context to your findings. Instead of just knowing that a certain percentage of your audience prefers eco-friendly shoes, you get to understand why they prefer them. Are they driven by concerns about climate change, peer influence, or simply a desire for unique, innovative products? This contextual understanding can help you craft more effective marketing messages.
Cons of Qualitative Research
While the strengths of qualitative research are many, it has limitations. Understanding these drawbacks is crucial for a balanced approach to your market research.
Limited Generalizability: Qualitative research typically involves smaller, more targeted sample sizes due to the time and resources required for in-depth interviews, focus groups, or observations. This means that while the insights you gather will be rich and detailed, they may not represent the views and experiences of your entire target population. For instance, the customers who participate in your focus groups might have particularly strong feelings about sustainability, which might not be as prevalent in the broader customer base.
Subjectivity: Unlike its quantitative counterpart, qualitative research relies heavily on interpretation and analysis. The findings are often expressed in words and narratives, making them susceptible to researcher bias. For example, two researchers might interpret a participant’s responses in a focus group differently, leading to different conclusions. Therefore, ensuring rigor and objectivity during the analysis phase is critical.
Time and Resource-Intensive: Conducting and analyzing qualitative research can be quite labor-intensive. Transcribing interviews, analyzing focus group discussions, and reviewing observational data require skilled moderators, transcription services, and a significant amount of time. Additionally, the need for specially trained researchers to conduct interviews or focus groups can add to the cost of the research.
These cons do not diminish the value of qualitative research; instead, they highlight the need for careful planning and thoughtful interpretation of the data gathered. By understanding this approach’s strengths and limitations, you can maximize its benefits and make informed decisions.

Understanding Quantitative Research
As we leave the deep-diving world of qualitative research, we surface to the realm of quantitative research, where the breadth of understanding is the key. Think of it as casting a wide net into the sea, gathering as many fish (or, in our case, data points) as possible to analyze and identify patterns or trends.
In contrast to qualitative research, quantitative research involves gathering measurable, numerical data. This can be accomplished through various methods, such as online surveys , questionnaires, or structured observations. The questions in this type of research are often closed-ended, offering a set of predefined responses for the participants to choose from. For instance, you might ask your customers to rate on a scale of 1-5 how likely they are to buy your new eco-friendly shoes or to select from a list of options their primary reason for purchasing such shoes.
The essence of quantitative research is the ability to quantify consumer behavior and attitudes. Rather than focusing on individual narratives, it provides a statistical representation of a large group’s feelings or behaviors. For instance, it might tell you that 65% of your target market is willing to pay a premium for eco-friendly footwear.
Quantitative research, like its qualitative counterpart, has a unique set of pros and cons, which can significantly impact your research results and, consequently, your business decisions.
Pros of Quantitative Research
Quantitative research provides a measurable, objective lens to view your market. Here are some of the key advantages it offers:
Generalizability: With its focus on large sample sizes, quantitative research enables you to gather data statistically representative of your target population. For instance, if your survey reveals that a significant percentage of respondents are willing to pay more for eco-friendly shoes, you can confidently infer this trend extends to your broader target market.
Measurable and Objective: Quantitative data can be precisely measured and easily analyzed using statistical methods. The responses you gather can be quantified, compared, and tracked over time, offering you valuable insights. For example, you can measure changes in consumer attitudes toward eco-friendly products over several years.
Efficiency: Given that quantitative research often employs online or paper surveys, you can collect data from a large number of respondents simultaneously. This method can be cost-effective and time-efficient, especially when compared to conducting numerous in-depth interviews or focus groups.

Cons of Quantitative Research
Despite the significant advantages of quantitative research, it’s essential to be mindful of its limitations to ensure a balanced approach to your market research.
Lack of Depth: While quantitative research excels in measuring and quantifying consumer behaviors and attitudes, it often doesn’t capture the nuances and underlying reasons for those behaviors. For example, although you might know from a survey that a substantial percentage of your target market prefers eco-friendly shoes, you won’t necessarily understand the specific motivations, emotions, or experiences behind this preference.
Limited Context: Quantitative research provides statistical data but often lacks the rich, detailed context of qualitative research. It tells you “what” the trends are but often falls short of explaining “why” those trends exist. For instance, your survey might reveal that younger customers are more likely to buy eco-friendly shoes, but without further qualitative investigation, the reasons for this demographic preference may remain unclear.
Potential for Survey Bias: The design of your quantitative surveys can significantly influence the accuracy of your results. Poorly constructed questions, leading prompts, or a lack of diverse response options can introduce bias, resulting in skewed data. For example, if your survey questions are biased towards positive responses about eco-friendly products, you may end up with an inflated perception of your target market’s interest in such products.
By recognizing these limitations, you can take steps to mitigate them, such as supplementing your quantitative data with qualitative insights or ensuring your survey design is as unbiased and inclusive as possible.
Choosing the Right Approach
At this point, you might wonder: Should I dive deep with qualitative research or cast a wide net with quantitative research? The truth is, there’s no one-size-fits-all answer. The most effective approach depends on several factors, including your research objectives, the representativeness and size of your sample, and the resources available to you.
Research Objectives: Your first consideration should be the purpose of your research. If you are at an exploratory stage, wanting to understand your target audience’s nuanced perspectives and motivations, qualitative research could be your best bet. On the other hand, quantitative research might be the way to go if you’re looking to test a hypothesis, measure the impact of a previous campaign, or collect data on a large scale.
Sample Size and Representativeness: If generalizability is a priority, and you want your research findings to represent your entire target market, then quantitative research, with its larger sample sizes, is generally more suitable. However, if your focus is on a smaller, more targeted group, qualitative research can offer the in-depth insights you need.
Time and Resource Constraints: Budget, time, and human resources are practical considerations that can impact your research choice. If you’re working within a tight budget or timeframe or have limited access to skilled qualitative researchers, a quantitative approach may be more efficient. Conversely, if you have the resources to conduct thorough interviews, focus groups, or ethnographic studies, qualitative research can yield rich, nuanced data.
Complementary Research: Remember that qualitative and quantitative research aren’t mutually exclusive. They can be effectively combined to offer a comprehensive view of your market. For instance, you could start with a qualitative study to explore consumer attitudes and behaviors and then design a quantitative survey based on those insights to gather data from a larger sample size. Alternatively, you might supplement quantitative data with qualitative research to add depth and context to your findings.
The right research methodology can make a significant difference in your understanding of your market and, consequently, the success of your marketing efforts. By carefully considering the above factors, you can select the most effective approach for your specific needs.
Navigating the world of market research and making these decisions can seem daunting. That’s where expert help can make a real difference. Consider partnering with a seasoned market research agency like Kadence International. With a wealth of experience across various industries and markets, we at Kadence can guide you in selecting the best research methodology tailored to your unique needs, ensuring you gain the insights needed to propel your business forward.
Ready to unlock the power of market research? Reach out to us, and let us guide you toward a better understanding your market and achieving business success.
Get regular insights
Keep up to date with the latest insights from our research as well as all our company news in our free monthly newsletter.
- First Name *
- Last Name *
- Business Email *

Helping brands uncover valuable insights
We’ve been working with Kadence on a couple of strategic projects, which influenced our product roadmap roll-out within the region. Their work has been exceptional in providing me the insights that I need. Senior Marketing Executive Arla Foods
Kadence’s reports give us the insight, conclusion and recommended execution needed to give us a different perspective, which provided us with an opportunity to relook at our go to market strategy in a different direction which we are now reaping the benefits from. Sales & Marketing Bridgestone
Kadence helped us not only conduct a thorough and insightful piece of research, its interpretation of the data provided many useful and unexpected good-news stories that we were able to use in our communications and interactions with government bodies. General Manager PR -Internal Communications & Government Affairs Mitsubishi
Kadence team is more like a partner to us. We have run a number of projects together and … the pro-activeness, out of the box thinking and delivering in spite of tight deadlines are some of the key reasons we always reach out to them. Vital Strategies
Kadence were an excellent partner on this project; they took time to really understand our business challenges, and developed a research approach that would tackle the exam question from all directions. The impact of the work is still being felt now, several years later. Customer Intelligence Director Wall Street Journal
Get In Touch
" (Required) " indicates required fields
Privacy Overview
What is quantitative research?
Last updated
20 February 2023
Reviewed by
Quantitative methods and data are used by some business owners, for example, to evaluate their business, diagnose issues, and identify opportunities.
Quantitative research is used throughout the natural and social sciences, including economics, sociology, chemistry, biology, psychology, and marketing.
Researchers use quantitative research to get objective, robust, and representative answers from individuals. Researchers gather quantitative data from sample groups of people and generalize it to a larger population. This is to, in some instances, explain a given phenomenon and answer questions about the population, such as product preferences, political persuasion, or demography.
For example, a hotel owner in the US can conduct quantitative research, perhaps via a questionnaire, on a small sample of their customers to understand their opinions about their products and services. The analyzed quantitative data from this questionnaire can be generalized to the larger population of their customers. The hotel can use these opinions to maintain or improve its service provision.
Make research less tedious
Dovetail streamlines research to help you uncover and share actionable insights
- Quantitative research methods
Researchers employ various quantitative research methods to determine certain phenomena.
Observation
This method involves gathering information by simply observing behaviors or counting subjects relevant to a study. For example, a researcher could sit in a classroom and observe students when a teacher is teaching, recording those who are and are not paying attention.
Survey is one of the most popular and well-known quantitative methods. It involves asking individuals questions either physically or, most typically nowadays, online. These questions are usually in the form of a questionnaire that individuals can respond to, using a mix of single, multichoice, ranking, rating, and occasionally open-ended questions .
For example, a researcher could administer a questionnaire to first-year international college students about their college experiences using various question formats.
Experimental
This scientific approach is conducted with two sets of data, i.e., independent and dependent variables . Usually, researchers approach experimental studies with specific hypotheses to test. They may use two groups of participants: one who would receive the “treatment” and one who would not.
For example, a researcher might wish to test a short-term mindfulness treatment for individuals with depression. In this case, the independent or manipulated variable would be the mindfulness treatment group. One group would receive the mindfulness treatment, and another would not. In this case, the “experiment” would be to see if the individuals who received the mindfulness treatment experienced fewer depressive symptoms than those who did not.
- What is quantitative analysis?
Quantitative analysis is a process that involves manipulating and evaluating collected, measurable data. The goal is to understand the behavior of a given phenomenon and answer a research question (and, in a scientific setting, prove or disprove a hypothesis).
A business owner, for example, may analyze quantitative sales data and consumer quantitative data using a questionnaire. By doing this, the owner can figure out if their business is doing well or if they need to make changes to improve.
If you are a business owner, you could consider quantitative analysis to better understand your business's past, present, and potential future.
- What do quantitative analysts do?
A quantitative analyst is an expert in designing, developing, and implementing algorithms to answer research questions. They use quantitative research methods to help companies make appropriate business and financial decisions.
The primary responsibility of a quantitative analyst is to apply quantitative methods to identify opportunities and evaluate risks.
Quantitative analysts are important to staff in any business because:
They manage portfolio risks
They test a new trading strategy
They program and implement a new trading strategy
They improve signals used to evaluate trade ideas
- Understanding quantitative analysis
Analysts use quantitative analysis to analyze a business's past, present, and future. You can also use quantitative analysis to determine the progress of your business.
State governments also use quantitative analysis to make monetary and other economic policy decisions. It is used in the financial services industry to analyze investment opportunities. For example, a business owner can use quantitative analysis to determine when to sell or purchase securities based on macroeconomic conditions.
Quantitative analysis versus qualitative analysis
If you are pursuing a career in research or business analysis, it is essential to understand the two concepts—quantitative and qualitative analysis.
Quantitative analysis, at a very basic level, relies on using numbers and discrete values collected from the research. In contrast, qualitative analysis relies on content (e.g., language or text data) that either can’t be expressed in numbers or doesn’t have sufficient scale to be counted or coded.
A business owner wanting to better understand their business might use a representative quantitative sample of customers to generate insight by completing a questionnaire. A website owner could analyze quantitative metrics associated with their website to understand which aspects of the site are working well and which elements need to be optimized. These include the length of visit, number of links clicked, and areas of the site visited.
Various measures could be correlated by sales (or other outcomes) to determine the UX and marketing strategy linked to the site.
Businesses might use qualitative analysis to get a greater depth of understanding or look at the ‘why’ behind the ‘what.’ For example, they might ask customers, who gave a low quantitative score for a provided product, why they gave that rating and how they might improve the said product.
- Advantages of quantitative research
Quantitative research, done right, can help drive a business's success and generate a general understanding of key business metrics and customer behavior, wants, and needs. Quantitative research should be considered for the following reasons:
It is efficient and fast
An experienced quantitative researcher can complete the reporting and analysis phase efficiently and quickly with a defined reporting structure and outputs while taking some time to define and structure questions (versus unstructured qualitative data ).
It is objective and requires limited interpretation
Quantitative research relies on standardized statistical processes and rules to answer research questions. If performed correctly, data generated from small sample groups can be extrapolated to represent the views of larger populations.
It is focused
Owing to its structure, the goals of quantitative research are determined at the beginning of the study, forcing researchers to clearly understand and define the objectives of their studies.
- Disadvantages of quantitative research
It’s only appropriate in certain cases
This method is only relevant when data can be captured and reflected in numbers. It cannot be used in situations where data is non-numerical, e.g., long-form verbal or textual responses that are not easily coded down into numerical responses.
It’s challenging to analyze the data collected
When quantitative research is collected, it can be difficult to make sense of the numbers without knowing statistical methods. Knowledge of research methods and data analytic techniques is essential for drawing conclusions about the study questions. These programs and methods take time to learn and can be time-consuming and complicated.
- What are the limitations of quantitative research?
Requires vast resources
This method requires a considerable investment of time, energy, and finance. One needs to prepare and structure questions, test their understanding and relevance, and determine how to distribute them to the respondents. Some respondents may expect payment or incentives to respond to the questions (this may be in the form of entry into a prize draw.)
Requires many respondents
Quantitative research generally requires access to (relative to other methods) large samples to ensure inferences made from the research are robust and reliable. Finding this audience, especially where the incidence is low can be both time-consuming and expensive.
Research is limited in its scope
What quantitative research can explore is limited due to the need to agree on the specific questions to be asked and analyzed versus qualitative research. The latter doesn’t define specific numbers and forms of questions in advance.
Why is it called quantitative research?
It is called quantitative research because it involves the use of ‘quantities’ of things—things that can be expressed in numbers or measured.
What does quantitative research answer?
Quantitative research answers questions measuring value or size, which can be expressed in numbers. It answers questions such as how many, how much, and how often.
For example, you can study the number of individuals who wish to study at American universities and their traits. Questions can include how many come from low, medium, or high socio-economic brackets, how many want to study law versus humanities, and what proportion feel excited versus anxious about the prospect of undertaking higher education.
Should you be using a customer insights hub?
Do you want to discover previous research faster?
Do you share your research findings with others?
Do you analyze research data?
Start for free today, add your research, and get to key insights faster
Editor’s picks
Last updated: 18 April 2023
Last updated: 27 February 2023
Last updated: 6 February 2023
Last updated: 5 February 2023
Last updated: 16 April 2023
Last updated: 9 March 2023
Last updated: 30 April 2024
Last updated: 12 December 2023
Last updated: 11 March 2024
Last updated: 4 July 2024
Last updated: 6 March 2024
Last updated: 5 March 2024
Last updated: 13 May 2024
Latest articles
Related topics, .css-je19u9{-webkit-align-items:flex-end;-webkit-box-align:flex-end;-ms-flex-align:flex-end;align-items:flex-end;display:-webkit-box;display:-webkit-flex;display:-ms-flexbox;display:flex;-webkit-flex-direction:row;-ms-flex-direction:row;flex-direction:row;-webkit-box-flex-wrap:wrap;-webkit-flex-wrap:wrap;-ms-flex-wrap:wrap;flex-wrap:wrap;-webkit-box-pack:center;-ms-flex-pack:center;-webkit-justify-content:center;justify-content:center;row-gap:0;text-align:center;max-width:671px;}@media (max-width: 1079px){.css-je19u9{max-width:400px;}.css-je19u9>span{white-space:pre;}}@media (max-width: 799px){.css-je19u9{max-width:400px;}.css-je19u9>span{white-space:pre;}} decide what to .css-1kiodld{max-height:56px;display:-webkit-box;display:-webkit-flex;display:-ms-flexbox;display:flex;-webkit-align-items:center;-webkit-box-align:center;-ms-flex-align:center;align-items:center;}@media (max-width: 1079px){.css-1kiodld{display:none;}} build next, decide what to build next, log in or sign up.
Get started for free
Find the right market research agencies, suppliers, platforms, and facilities by exploring the services and solutions that best match your needs
list of top MR Specialties
Browse all specialties
Browse Companies and Platforms
by Specialty
by Location
Browse Focus Group Facilities

Manage your listing
Follow a step-by-step guide with online chat support to create or manage your listing.
About Greenbook Directory
IIEX Conferences
Discover the future of insights at the Insight Innovation Exchange (IIEX) event closest to you
IIEX Virtual Events
Explore important trends, best practices, and innovative use cases without leaving your desk
Insights Tech Showcase
See the latest research tech in action during curated interactive demos from top vendors
Stay updated on what’s new in insights and learn about solutions to the challenges you face
Greenbook Future list
An esteemed awards program that supports and encourages the voices of emerging leaders in the insight community.
Insight Innovation Competition
Submit your innovation that could impact the insights and market research industry for the better.
Find your next position in the world's largest database of market research and data analytics jobs.

For Suppliers
Directory: Renew your listing
Directory: Create a listing
Event sponsorship
Get Recommended Program
Digital Ads
Content marketing
Ads in Reports
Podcasts sponsorship
Run your Webinar
Host a Tech Showcase
Future List Partnership
All services

Dana Stanley
Greenbook’s Chief Revenue Officer
Research Methodologies
August 14, 2024
Qualitative vs. Quantitative Market Research: Why Not Both?
Discover the benefits of qualitative and quantitative methods. Learn how to leverage both approaches for insights into consumer behavior and industry trends.
by Ashley Shedlock
Content Coordinator at Greenbook
Market research is vital for understanding target markets, consumer behavior, and industry trends. Qualitative and quantitative methods offer distinct advantages. Qualitative research explores concepts, opinions, and motivations, uncovering rich insights into consumer preferences through techniques like interviews and focus groups.
Quantitative market research involves gathering numerical data through surveys and questionnaires for statistical analysis to identify trends in a target market. It offers measurable results from a large sample size for generalization and prediction. On the other hand, qualitative research explores subjective experiences and motivations, aiming to provide deeper insights into consumer behavior through non-statistical analysis.
Selecting the appropriate research approach is vital for successful studies. Qualitative dives into intricate matters, while quantitative gauges broader market trends. The choice between qualitative and quantitative methods depends on research objectives and results. Both offer valuable insights for strategic decisions in competitive markets. Knowing the distinctions between the methods aids in picking the optimal approach for meaningful data and a competitive advantage.
What is Qualitative Market Research?
Qualitative research methodologies, such as in-depth interviews and focus groups, play a crucial role in providing a deeper understanding of consumer behavior. These methodologies delve into the intricacies of individual attitudes and motivations, allowing researchers to uncover rich insights that quantitative data alone cannot reveal.
One of the key advantages of qualitative research lies in its ability to explore the underlying reasons behind consumer behaviors. By allowing researchers to engage directly with participants, qualitative methods offer a more holistic view of consumer attitudes, preferences, and decision-making processes. This approach can uncover nuanced insights that quantitative surveys may overlook.
However, it is important to acknowledge the limitations of qualitative research, particularly in its subjective nature. The reliance on human interpretation in qualitative analysis introduces the potential for biases to influence outcomes. Researchers must be vigilant in managing subjectivity and potential biases throughout the research process to ensure the credibility and reliability of their findings.
In real-world applications, qualitative research proves invaluable in various contexts, from product development to marketing strategies. By gaining a deep understanding of consumer perspectives and behaviors, businesses can tailor their offerings to meet customer needs more effectively. Qualitative research also plays a crucial role in shaping communication strategies and enhancing customer engagement by tapping into the emotional and psychological drivers behind consumer decisions.
While qualitative research may come with its challenges in terms of subjectivity and potential biases, its ability to provide rich, nuanced insights into consumer behavior makes it a valuable tool for any market researcher looking to gain a deeper understanding of their target audience.
Types of Qualitative Research
When it comes to qualitative research, there are various types that provide unique insights into consumer behavior and preferences.
Ethnographic Research: Involves immersing researchers in the environment or context of the subjects to observe their behaviors in real-life settings. This approach goes beyond simply asking questions, allowing researchers to uncover deeper insights into how consumers interact with products or services on a day-to-day basis.
In-depth Interviews: Enable researchers to explore participants' thoughts and motivations thoroughly by asking open-ended questions. Focus groups, another qualitative method, involve a small group discussing a topic, allowing researchers to observe group dynamics and shared perspectives.
Observational Research: the direct observation and recording of participant behavior in natural settings. This approach is particularly valuable for capturing nonverbal cues and subconscious behaviors that might not surface during standard interview formats. By focusing on body language, gestures, and interactions, researchers can gain profound insights into consumer preferences and the intricacies of decision-making processes.
Advantages of Qualitative Research
Qualitative research offers valuable insights into the emotional and psychological aspects of consumer decision-making, uncovering the reasons behind consumer behaviors.
Qualitative research offers flexibility and adaptability, allowing researchers to adjust approaches based on emerging insights. By directly engaging with participants, it uncovers hidden motivations and attitudes that may not be easily quantified, fostering a human connection for authentic data collection.
Qualitative data delves into intricate consumer emotions, brand perceptions, and societal influences on purchasing choices. It forms hypotheses tested later via quantitative research , enhancing insights into consumer behavior. Utilizing the qualitative aspect provides a profound grasp of intricacies determining consumer preferences and market trends.
What is Quantitative Market Research?
Quantitative methods play a vital role in market research by using surveys and questionnaires to gather structured data systematically. This approach provides measurable insights into consumer behavior, trends, and preferences, offering a comprehensive view of the market. A key benefit is the statistical analysis capability, allowing researchers to identify correlations and predictive patterns within large datasets. This analytical depth enables data-driven decision-making and strategic planning based on empirical evidence.
However, like any methodological approach, quantitative research does have its limitations. One notable constraint is the potential difficulty in capturing nuanced or complex phenomena that may be better understood through qualitative means. While quantitative research excels in quantifying data and providing statistical significance, it may sometimes overlook the underlying reasons or motivations driving consumer behavior. This limitation underscores the complementary role that qualitative research plays in offering deeper insights into the 'whys' behind the 'whats' uncovered through quantitative analysis.
Quantitative research is widely used in different industries for tasks like market segmentation , customer profiling, and product testing. It helps businesses evaluate market share, consumer preferences, and marketing campaign effectiveness with credibility and objectivity. Stakeholders can rely on the empirical evidence from quantitative research to make informed decisions for business growth and innovation.
Types of Quantitative Research
Quantitative research involves the collection and analysis of numerical data to understand patterns, correlations, and trends in a target audience or market. This method utilizes structured questionnaires, surveys, and experiments to gather information that can be statistically analyzed for meaningful insights.
One common type of quantitative research is surveys, which provide a snapshot of the opinions, behaviors, and preferences of a large group of people. Another approach is experiments, where variables are manipulated to study cause-and-effect relationships within a controlled environment. These quantitative methods offer the advantage of producing numerical data that can be easily quantified and compared across different groups or time periods.
Advantages of Quantitative Research
Quantitative research offers a plethora of advantages that make it an indispensable tool in the realm of market analysis.
Quantitative research excels in offering numerical data for statistical analysis, ensuring objective insights into market trends and consumer behavior through structured surveys and experiments.
Quantitative data is ideal for large sample sizes, providing generalizable insights applicable to broader populations. The scalability enhances reliability, revealing trends not obvious in smaller studies. In fast-paced markets, the quick data collection, analysis, and interpretation of quantitative research are advantageous for swift decision-making.
Quantitative research is crucial for marketers to measure variables and determine causal relationships, aiding in understanding consumer behavior and strategic decision-making. Techniques like regression analysis or correlation studies unveil hidden patterns, offering valuable market insights and ensuring businesses remain competitive.
Quantitative research not only provides analytical rigor and scalability but also allows for easy comparability and benchmarking. It quantifies data in numerical terms, facilitating comparisons of variables, tracking changes over time, and benchmarking against industry standards or competitors. This comparative nature empowers businesses to identify best practices, evaluate market positioning, and optimize strategies effectively.
Comparing Qualitative and Quantitative Approaches
Combining qualitative and quantitative research methods provides a comprehensive understanding of market dynamics. Triangulating data from both sources offers a well-rounded perspective. Qualitative methods like interviews reveal consumer motivations, while surveys give broader trends. Selecting between qualitative and quantitative research hinges on research objectives and the nature of questions. Qualitative research delves into complex phenomena, while quantitative uncovers patterns at scale. The choice depends on study goals and required information for decision-making.
Common misconceptions about qualitative research often revolve around its perceived subjectivity and lack of generalizability. However, when conducted rigorously, qualitative research can provide valuable insights into the underlying reasons behind consumer behaviors and preferences. On the other hand, quantitative research is sometimes criticized for being too rigid and detached from the human experience. In reality, quantitative methods can yield actionable data that reveal trends and correlations with a high degree of reliability.
Market research methodologies are evolving to prioritize a balance between qualitative depth and quantitative breadth. Combining qualitative richness with quantitative rigor provides a holistic view of consumer behavior, uncovering patterns and underlying motivations effectively. Emerging trends in market research incorporate advanced analytics such as predictive modeling and machine learning for faster, more precise decision-making. The future of market research lies in integrating qualitative and quantitative approaches, emphasizing innovation to navigate complexities and derive valuable strategic insights.
How to Choose the Right Method? Quantitative vs Qualitative Research
When choosing between quantitative and qualitative market research, align the method with your research goals. Quantitative research gathers numerical data for statistical analysis, while qualitative research explores underlying reasons and opinions through interviews or observation.
The decision depends on research objectives. Quantitative research quantifies data for testing hypotheses and generalizing results, ideal for customer satisfaction or A/B testing . Conversely, qualitative research offers insights into behavior and preferences through open-ended questions and exploratory techniques like content analysis or ethnographic studies.
Consider timing and resources: quantitative research needs larger samples for statistical significance, while qualitative research is flexible with smaller samples. For quick feedback, opt for quantitative surveys or experimental studies.
Balancing detailed insights with ample data is crucial in research. A mixed-method approach often provides the most complete understanding. The key is to align your research method with your goals, resources, and desired insights to make informed decisions that enhance your marketing strategies and business outcomes.
Ashley Shedlock
10 articles
The views, opinions, data, and methodologies expressed above are those of the contributor(s) and do not necessarily reflect or represent the official policies, positions, or beliefs of Greenbook.
Comments are moderated to ensure respect towards the author and to prevent spam or self-promotion. Your comment may be edited, rejected, or approved based on these criteria. By commenting, you accept these terms and take responsibility for your contributions.
More from Ashley Shedlock
Brand Strategy
Brand Tracking Tech 101
Gain valuable insights into consumer preferences and behaviors with brand tracking. Stay ahead of the competition by monitoring key brand metrics cons...
July 31, 2024
Read article
How to Use Automation in Research
Discover the power of automation in research. Streamline processes and enhance efficiency. Transform data collection and analysis for speed and scalab...
July 26, 2024
Customer Experience (CX)
How to Use Mystery Shopping Research to Improve the Customer Experience
Discover the power of mystery shopping research in improving customer experience. Uncover service strengths and exceed customer expectations to boost ...
July 25, 2024
Data Science
Is Now The Time For Synthetic Sample?
Explore the world of synthetic data for decision-making. Fuel research with experiments and simulations while maintaining privacy and statistical prop...
July 16, 2024
Top in Quantitative Research
Moving Away from a Narcissistic Market Research Model
Why are we still measuring brand loyalty? It isn’t something that naturally comes up with consumers, who rarely think about brand first, if at all. Ma...
Devora Rogers
Chief Strategy Officer at Alter Agents
May 31, 2023
Sign Up for Updates
Get content that matters, written by top insights industry experts, delivered right to your inbox.
67k+ subscribers
Weekly Newsletter
Greenbook Podcast
Event Updates
I agree to receive emails with insights-related content from Greenbook. I understand that I can manage my email preferences or unsubscribe at any time and that Greenbook protects my privacy under the General Data Protection Regulation.*
Get the latest updates from top market research, insights, and analytics experts delivered weekly to your inbox
Your guide for all things market research and consumer insights
Create a New Listing
Manage My Listing
Find Companies
Find Focus Group Facilities
Tech Showcases
GRIT Report
Expert Channels
Get in touch
Marketing Services
Future List
Publish With Us
Privacy policy
Cookie policy
Terms of use
Copyright © 2024 New York AMA Communication Services, Inc. All rights reserved. 234 5th Avenue, 2nd Floor, New York, NY 10001 | Phone: (212) 849-2752
9 Quantitative Research Methods With Real Client Examples
- June 21, 2021
- Tallwave Team
Share Article
Quantitative research is essential to developing a clear understanding of consumer engagement and how to increase satisfaction.
Primary Quantitative Research Methods
When it comes to quantitative research, many people often confuse this type of research with the methodology. The research type refers to style of research while the data collection method can be different.
Research types
These are the primary types of quantitative research used by businesses today.
- Survey research: Ideally when conducting survey research businesses will use a statistically relevant sample to understand the sentiments and actions of a large group of people. This could be their current customers or consumers who fit into their ideal demographic.
- Correlational research: Correlational research compares two variables to come to a conclusion about whether there is a relationship between the two. Keep in mind that correlation does not always imply causation, which is to say you need to account for external variables that could cause an apparent relationship.
- Experimental research: This form of research takes a scientific approach, testing a hypothesis by manipulating certain variables to understand what changes this could cause. In these experiments, there is a control group and a manipulated group.
Also read: 6 Factors Influencing Customer Behaviors in 2021
Data collection methods
Launching the above research requires creating a plan to collect data. After all, quantitative research relies on data. Here are the common primary data collection methods for quantitative research.
- Surveys: A common approach to collecting data is using a survey. This is ideal especially if the business can obtain a statistically relevant sample from their responses. Surveys are often conducted through web or email questionnaires.
- Interviews: Yes, interviews can be used to obtain quantitative data. While this form of data collection is typically associated with qualitative research, interviewers can ask a standard set of questions to collate formal, quantitative data.
- Documentation review: With an increasing amount of business occurring digitally, there is more documentation now than ever before to help inform quantitative conclusions. Businesses can assess website metrics such as return visits, time on page or even use a pixel to track customer movement across websites. They can also view how many times their app has been opened and actions users have taken on their platform to determine customer engagement.
Secondary research can be helpful when formulating a plan for obtaining primary quantitative data. It can help narrow areas of focus or illuminate key challenges.
Secondary Quantitative Research Methods
Secondary data is information that is already collected and not necessarily exclusive to the company but still relevant when understanding overall industry and marketplace trends. Here are a few examples of secondary data:
- Government reports: Government research can indicate potential regulatory roadblocks, customer pain points and future opportunities. For example, a fitness company might use government data that shows an increase in use of outdoor running trials to develop a new product used to meet that specific use case.
- Survey-based secondary data: Polls or surveys that have been conducted for a primary use could be reused for secondary purposes. This could include survey data obtained by other companies or governments.
- Academic research: Research that has been previously conducted and published in peer-reviewed journals can help inform trends and consumer behavior, even if it doesn’t apply to a company’s specific customers.
Secondary research can be helpful when formulating a plan for obtaining primary quantitative data. It can help narrow areas of focus or illuminate key challenges. It can also help when it comes to interpreting primary data, especially when trying to understand the relationship between two variables of correlated data.
Also read: The What, Why, & How of Customer Behavior Analysis
Real Examples of Quantitative Research
We regularly use quantitative research to help our clients understand where they can best add value to increase customer engagement. Here are three examples of quantitative research in motion.
Example 1: Leading food distribution company
We helped a leading food distribution company identify changes in the needs and values of their restaurant clients as a result of COVID-19. This helped inform opportunities to become more valuable partners.
The research plan involved creating a survey that was emailed to clients. The questions were specific and numeric. For example, respondents were asked what percentage of their weekly spend was used with the food distribution company. They were also asked to assign a percentage to the way their food ordering had changed during COVID-19 and to rate their satisfaction with the food distribution company.
The results showed changes that had occurred for clients of the food distribution company as a result of the unique stressors of the pandemic. We were able to determine changes in weekly food supply and customer count as well as menu adaptations and purchase behavior.
Example 2: Leading credit card company
Our work with a leading credit card company required us to understand what current travel card members valued about the rewards program and their preferred communication method for booking travel in order to create an omnichannel servicing strategy and ideal customer journey.
Through an online survey of younger cardholders, the target demographic for this project, we asked questions such as length of card membership, total spend and the number of annual leisure trips in addition to more specific questions that showed how members get inspiration for trip planning and where they research.
The results highlighted ways to overcome resistance to pricing by proving more value. It also illuminated ways to make the benefits of membership more tangible to card holders and how to influence travelers in the early stages of planning their journey.
Example 3: Internal research report
We’re in the business of drinking our own champagne, so to speak, which is why we conducted our own quantitative research aimed at understanding the consumer trends that were spurred by the pandemic and how these will transform behaviors in the future.
There’s no question that new customer experiences emerged from the pandemic. Think of offerings such as “buy online, pickup in store (BOPIS),” or blended restaurant meals that are cooked at home. We wanted to understand how consumers truly felt about these new experiences and which they were likely to continue using even after restrictions were lifted. We also wanted to know more about the changing expectations for branded communication and how all of these pieces of the puzzle fit together to create consumer engagement. Our method of data collection was a survey.
Our research led us to develop insights we could use to inform our customers in their decision making. For example, we found convenience is paramount for consumers who are seeking out hybrid experiences such as BOPIS to take the best of both worlds. We also found many of these changes are permanent as consumers embraced new experiences that made their lives easier.
We regularly use quantitative research to help our clients understand where they can best add value to increase customer engagement.
The Bottom Line
Quantitative research is essential to developing a clear understanding of consumer engagement and how to increase satisfaction. Though online surveys are one of the most common methods for obtaining data, research isn’t limited to this strategy. It’s important to use whatever strategies are within your scope to constantly evaluate new trends and consumer behaviors that could significantly impact your offerings. The results can show you how to re-engage customers and drive loyalty.
Interested in partnering with us to learn more about your customers needs, wants, and behaviors to inform future experience design? Contact us today !
Tallwave Headquarters
6720 N. Scottsdale Road, Suite 140 Scottsdale, Arizona 85253 (602) 840-0400
For business inquiries, contact Ed Borromeo, Tallwave Partner at [email protected]

©2024 Tallwave LLC. All rights reserved.
Terms of Use
Bunger Steel
Doing some things and making some impacts
- Skip to main content
- Skip to primary sidebar
- Skip to footer
- QuestionPro

- Solutions Industries Gaming Automotive Sports and events Education Government Travel & Hospitality Financial Services Healthcare Cannabis Technology Use Case AskWhy Communities Audience Contactless surveys Mobile LivePolls Member Experience GDPR Positive People Science 360 Feedback Surveys
- Resources Blog eBooks Survey Templates Case Studies Training Help center
Home Market Research
Quantitative Research: What It Is, Practices & Methods

Quantitative research involves analyzing and gathering numerical data to uncover trends, calculate averages, evaluate relationships, and derive overarching insights. It’s used in various fields, including the natural and social sciences. Quantitative data analysis employs statistical techniques for processing and interpreting numeric data.
Research designs in the quantitative realm outline how data will be collected and analyzed with methods like experiments and surveys. Qualitative methods complement quantitative research by focusing on non-numerical data, adding depth to understanding. Data collection methods can be qualitative or quantitative, depending on research goals. Researchers often use a combination of both approaches to gain a comprehensive understanding of phenomena.
What is Quantitative Research?
Quantitative research is a systematic investigation of phenomena by gathering quantifiable data and performing statistical, mathematical, or computational techniques. Quantitative research collects statistically significant information from existing and potential customers using sampling methods and sending out online surveys , online polls , and questionnaires , for example.
One of the main characteristics of this type of research is that the results can be depicted in numerical form. After carefully collecting structured observations and understanding these numbers, it’s possible to predict the future of a product or service, establish causal relationships or Causal Research , and make changes accordingly. Quantitative research primarily centers on the analysis of numerical data and utilizes inferential statistics to derive conclusions that can be extrapolated to the broader population.
An example of a quantitative research study is the survey conducted to understand how long a doctor takes to tend to a patient when the patient walks into the hospital. A patient satisfaction survey can be administered to ask questions like how long a doctor takes to see a patient, how often a patient walks into a hospital, and other such questions, which are dependent variables in the research. This kind of research method is often employed in the social sciences, and it involves using mathematical frameworks and theories to effectively present data, ensuring that the results are logical, statistically sound, and unbiased.
Data collection in quantitative research uses a structured method and is typically conducted on larger samples representing the entire population. Researchers use quantitative methods to collect numerical data, which is then subjected to statistical analysis to determine statistically significant findings. This approach is valuable in both experimental research and social research, as it helps in making informed decisions and drawing reliable conclusions based on quantitative data.
Quantitative Research Characteristics
Quantitative research has several unique characteristics that make it well-suited for specific projects. Let’s explore the most crucial of these characteristics so that you can consider them when planning your next research project:

- Structured tools: Quantitative research relies on structured tools such as surveys, polls, or questionnaires to gather quantitative data . Using such structured methods helps collect in-depth and actionable numerical data from the survey respondents, making it easier to perform data analysis.
- Sample size: Quantitative research is conducted on a significant sample size representing the target market . Appropriate Survey Sampling methods, a fundamental aspect of quantitative research methods, must be employed when deriving the sample to fortify the research objective and ensure the reliability of the results.
- Close-ended questions: Closed-ended questions , specifically designed to align with the research objectives, are a cornerstone of quantitative research. These questions facilitate the collection of quantitative data and are extensively used in data collection processes.
- Prior studies: Before collecting feedback from respondents, researchers often delve into previous studies related to the research topic. This preliminary research helps frame the study effectively and ensures the data collection process is well-informed.
- Quantitative data: Typically, quantitative data is represented using tables, charts, graphs, or other numerical forms. This visual representation aids in understanding the collected data and is essential for rigorous data analysis, a key component of quantitative research methods.
- Generalization of results: One of the strengths of quantitative research is its ability to generalize results to the entire population. It means that the findings derived from a sample can be extrapolated to make informed decisions and take appropriate actions for improvement based on numerical data analysis.
Quantitative Research Methods
Quantitative research methods are systematic approaches used to gather and analyze numerical data to understand and draw conclusions about a phenomenon or population. Here are the quantitative research methods:
- Primary quantitative research methods
- Secondary quantitative research methods
Primary Quantitative Research Methods
Primary quantitative research is the most widely used method of conducting market research. The distinct feature of primary research is that the researcher focuses on collecting data directly rather than depending on data collected from previously done research. Primary quantitative research design can be broken down into three further distinctive tracks and the process flow. They are:
A. Techniques and Types of Studies
There are multiple types of primary quantitative research. They can be distinguished into the four following distinctive methods, which are:
01. Survey Research
Survey Research is fundamental for all quantitative outcome research methodologies and studies. Surveys are used to ask questions to a sample of respondents, using various types such as online polls, online surveys, paper questionnaires, web-intercept surveys , etc. Every small and big organization intends to understand what their customers think about their products and services, how well new features are faring in the market, and other such details.
By conducting survey research, an organization can ask multiple survey questions , collect data from a pool of customers, and analyze this collected data to produce numerical results. It is the first step towards collecting data for any research. You can use single ease questions . A single-ease question is a straightforward query that elicits a concise and uncomplicated response.
This type of research can be conducted with a specific target audience group and also can be conducted across multiple groups along with comparative analysis . A prerequisite for this type of research is that the sample of respondents must have randomly selected members. This way, a researcher can easily maintain the accuracy of the obtained results as a huge variety of respondents will be addressed using random selection.
Traditionally, survey research was conducted face-to-face or via phone calls. Still, with the progress made by online mediums such as email or social media, survey research has also spread to online mediums.There are two types of surveys , either of which can be chosen based on the time in hand and the kind of data required:
Cross-sectional surveys: Cross-sectional surveys are observational surveys conducted in situations where the researcher intends to collect data from a sample of the target population at a given point in time. Researchers can evaluate various variables at a particular time. Data gathered using this type of survey is from people who depict similarity in all variables except the variables which are considered for research . Throughout the survey, this one variable will stay constant.
- Cross-sectional surveys are popular with retail, SMEs, and healthcare industries. Information is garnered without modifying any parameters in the variable ecosystem.
- Multiple samples can be analyzed and compared using a cross-sectional survey research method.
- Multiple variables can be evaluated using this type of survey research.
- The only disadvantage of cross-sectional surveys is that the cause-effect relationship of variables cannot be established as it usually evaluates variables at a particular time and not across a continuous time frame.
Longitudinal surveys: Longitudinal surveys are also observational surveys , but unlike cross-sectional surveys, longitudinal surveys are conducted across various time durations to observe a change in respondent behavior and thought processes. This time can be days, months, years, or even decades. For instance, a researcher planning to analyze the change in buying habits of teenagers over 5 years will conduct longitudinal surveys.
- In cross-sectional surveys, the same variables were evaluated at a given time, and in longitudinal surveys, different variables can be analyzed at different intervals.
- Longitudinal surveys are extensively used in the field of medicine and applied sciences. Apart from these two fields, they are also used to observe a change in the market trend analysis , analyze customer satisfaction, or gain feedback on products/services.
- In situations where the sequence of events is highly essential, longitudinal surveys are used.
- Researchers say that when research subjects need to be thoroughly inspected before concluding, they rely on longitudinal surveys.
02. Correlational Research
A comparison between two entities is invariable. Correlation research is conducted to establish a relationship between two closely-knit entities and how one impacts the other, and what changes are eventually observed. This research method is carried out to give value to naturally occurring relationships, and a minimum of two different groups are required to conduct this quantitative research method successfully. Without assuming various aspects, a relationship between two groups or entities must be established.
Researchers use this quantitative research design to correlate two or more variables using mathematical analysis methods. Patterns, relationships, and trends between variables are concluded as they exist in their original setup. The impact of one of these variables on the other is observed, along with how it changes the relationship between the two variables. Researchers tend to manipulate one of the variables to attain the desired results.
Ideally, it is advised not to make conclusions merely based on correlational research. This is because it is not mandatory that if two variables are in sync that they are interrelated.
Example of Correlational Research Questions :
- The relationship between stress and depression.
- The equation between fame and money.
- The relation between activities in a third-grade class and its students.
03. Causal-comparative Research
This research method mainly depends on the factor of comparison. Also called quasi-experimental research , this quantitative research method is used by researchers to conclude the cause-effect equation between two or more variables, where one variable is dependent on the other independent variable. The independent variable is established but not manipulated, and its impact on the dependent variable is observed. These variables or groups must be formed as they exist in the natural setup. As the dependent and independent variables will always exist in a group, it is advised that the conclusions are carefully established by keeping all the factors in mind.
Causal-comparative research is not restricted to the statistical analysis of two variables but extends to analyzing how various variables or groups change under the influence of the same changes. This research is conducted irrespective of the type of relationship that exists between two or more variables. Statistical analysis plan is used to present the outcome using this quantitative research method.
Example of Causal-Comparative Research Questions:
- The impact of drugs on a teenager. The effect of good education on a freshman. The effect of substantial food provision in the villages of Africa.
04. Experimental Research
Also known as true experimentation, this research method relies on a theory. As the name suggests, experimental research is usually based on one or more theories. This theory has yet to be proven before and is merely a supposition. In experimental research, an analysis is done around proving or disproving the statement. This research method is used in natural sciences. Traditional research methods are more effective than modern techniques.
There can be multiple theories in experimental research. A theory is a statement that can be verified or refuted.
After establishing the statement, efforts are made to understand whether it is valid or invalid. This quantitative research method is mainly used in natural or social sciences as various statements must be proved right or wrong.
- Traditional research methods are more effective than modern techniques.
- Systematic teaching schedules help children who struggle to cope with the course.
- It is a boon to have responsible nursing staff for ailing parents.
B. Data Collection Methodologies
The second major step in primary quantitative research is data collection. Data collection can be divided into sampling methods and data collection using surveys and polls.
01. Data Collection Methodologies: Sampling Methods
There are two main sampling methods for quantitative research: Probability and Non-probability sampling .
Probability sampling: A theory of probability is used to filter individuals from a population and create samples in probability sampling . Participants of a sample are chosen by random selection processes. Each target audience member has an equal opportunity to be selected in the sample.
There are four main types of probability sampling:
- Simple random sampling: As the name indicates, simple random sampling is nothing but a random selection of elements for a sample. This sampling technique is implemented where the target population is considerably large.
- Stratified random sampling: In the stratified random sampling method , a large population is divided into groups (strata), and members of a sample are chosen randomly from these strata. The various segregated strata should ideally not overlap one another.
- Cluster sampling: Cluster sampling is a probability sampling method using which the main segment is divided into clusters, usually using geographic segmentation and demographic segmentation parameters.
- Systematic sampling: Systematic sampling is a technique where the starting point of the sample is chosen randomly, and all the other elements are chosen using a fixed interval. This interval is calculated by dividing the population size by the target sample size.
Non-probability sampling: Non-probability sampling is where the researcher’s knowledge and experience are used to create samples. Because of the researcher’s involvement, not all the target population members have an equal probability of being selected to be a part of a sample.
There are five non-probability sampling models:
- Convenience sampling: In convenience sampling , elements of a sample are chosen only due to one prime reason: their proximity to the researcher. These samples are quick and easy to implement as there is no other parameter of selection involved.
- Consecutive sampling: Consecutive sampling is quite similar to convenience sampling, except for the fact that researchers can choose a single element or a group of samples and conduct research consecutively over a significant period and then perform the same process with other samples.
- Quota sampling: Using quota sampling , researchers can select elements using their knowledge of target traits and personalities to form strata. Members of various strata can then be chosen to be a part of the sample as per the researcher’s understanding.
- Snowball sampling: Snowball sampling is conducted with target audiences who are difficult to contact and get information. It is popular in cases where the target audience for analysis research is rare to put together.
- Judgmental sampling: Judgmental sampling is a non-probability sampling method where samples are created only based on the researcher’s experience and research skill .
02. Data collection methodologies: Using surveys & polls
Once the sample is determined, then either surveys or polls can be distributed to collect the data for quantitative research.
Using surveys for primary quantitative research
A survey is defined as a research method used for collecting data from a pre-defined group of respondents to gain information and insights on various topics of interest. The ease of survey distribution and the wide number of people it can reach depending on the research time and objective makes it one of the most important aspects of conducting quantitative research.
Fundamental levels of measurement – nominal, ordinal, interval, and ratio scales
Four measurement scales are fundamental to creating a multiple-choice question in a survey. They are nominal, ordinal, interval, and ratio measurement scales without the fundamentals of which no multiple-choice questions can be created. Hence, it is crucial to understand these measurement levels to develop a robust survey.
Use of different question types
To conduct quantitative research, close-ended questions must be used in a survey. They can be a mix of multiple question types, including multiple-choice questions like semantic differential scale questions , rating scale questions , etc.
Survey Distribution and Survey Data Collection
In the above, we have seen the process of building a survey along with the research design to conduct primary quantitative research. Survey distribution to collect data is the other important aspect of the survey process. There are different ways of survey distribution. Some of the most commonly used methods are:
- Email: Sending a survey via email is the most widely used and effective survey distribution method. This method’s response rate is high because the respondents know your brand. You can use the QuestionPro email management feature to send out and collect survey responses.
- Buy respondents: Another effective way to distribute a survey and conduct primary quantitative research is to use a sample. Since the respondents are knowledgeable and are on the panel by their own will, responses are much higher.
- Embed survey on a website: Embedding a survey on a website increases a high number of responses as the respondent is already in close proximity to the brand when the survey pops up.
- Social distribution: Using social media to distribute the survey aids in collecting a higher number of responses from the people that are aware of the brand.
- QR code: QuestionPro QR codes store the URL for the survey. You can print/publish this code in magazines, signs, business cards, or on just about any object/medium.
- SMS survey: The SMS survey is a quick and time-effective way to collect a high number of responses.
- Offline Survey App: The QuestionPro App allows users to circulate surveys quickly, and the responses can be collected both online and offline.
Survey example
An example of a survey is a short customer satisfaction (CSAT) survey that can quickly be built and deployed to collect feedback about what the customer thinks about a brand and how satisfied and referenceable the brand is.
Using polls for primary quantitative research
Polls are a method to collect feedback using close-ended questions from a sample. The most commonly used types of polls are election polls and exit polls . Both of these are used to collect data from a large sample size but using basic question types like multiple-choice questions.
C. Data Analysis Techniques
The third aspect of primary quantitative research design is data analysis . After collecting raw data, there must be an analysis of this data to derive statistical inferences from this research. It is important to relate the results to the research objective and establish the statistical relevance of the results.
Remember to consider aspects of research that were not considered for the data collection process and report the difference between what was planned vs. what was actually executed.
It is then required to select precise Statistical Analysis Methods , such as SWOT, Conjoint, Cross-tabulation, etc., to analyze the quantitative data.
- SWOT analysis: SWOT Analysis stands for the acronym of Strengths, Weaknesses, Opportunities, and Threat analysis. Organizations use this statistical analysis technique to evaluate their performance internally and externally to develop effective strategies for improvement.
- Conjoint Analysis: Conjoint Analysis is a market analysis method to learn how individuals make complicated purchasing decisions. Trade-offs are involved in an individual’s daily activities, and these reflect their ability to decide from a complex list of product/service options.
- Cross-tabulation: Cross-tabulation is one of the preliminary statistical market analysis methods which establishes relationships, patterns, and trends within the various parameters of the research study.
- TURF Analysis: TURF Analysis , an acronym for Totally Unduplicated Reach and Frequency Analysis, is executed in situations where the reach of a favorable communication source is to be analyzed along with the frequency of this communication. It is used for understanding the potential of a target market.
Inferential statistics methods such as confidence interval, the margin of error, etc., can then be used to provide results.
Secondary Quantitative Research Methods
Secondary quantitative research or desk research is a research method that involves using already existing data or secondary data. Existing data is summarized and collated to increase the overall effectiveness of the research.
This research method involves collecting quantitative data from existing data sources like the internet, government resources, libraries, research reports, etc. Secondary quantitative research helps to validate the data collected from primary quantitative research and aid in strengthening or proving, or disproving previously collected data.
The following are five popularly used secondary quantitative research methods:
- Data available on the internet: With the high penetration of the internet and mobile devices, it has become increasingly easy to conduct quantitative research using the internet. Information about most research topics is available online, and this aids in boosting the validity of primary quantitative data.
- Government and non-government sources: Secondary quantitative research can also be conducted with the help of government and non-government sources that deal with market research reports. This data is highly reliable and in-depth and hence, can be used to increase the validity of quantitative research design.
- Public libraries: Now a sparingly used method of conducting quantitative research, it is still a reliable source of information, though. Public libraries have copies of important research that was conducted earlier. They are a storehouse of valuable information and documents from which information can be extracted.
- Educational institutions: Educational institutions conduct in-depth research on multiple topics, and hence, the reports that they publish are an important source of validation in quantitative research.
- Commercial information sources: Local newspapers, journals, magazines, radio, and TV stations are great sources to obtain data for secondary quantitative research. These commercial information sources have in-depth, first-hand information on market research, demographic segmentation, and similar subjects.
Quantitative Research Examples
Some examples of quantitative research are:
- A customer satisfaction template can be used if any organization would like to conduct a customer satisfaction (CSAT) survey . Through this kind of survey, an organization can collect quantitative data and metrics on the goodwill of the brand or organization in the customer’s mind based on multiple parameters such as product quality, pricing, customer experience, etc. This data can be collected by asking a net promoter score (NPS) question , matrix table questions, etc. that provide data in the form of numbers that can be analyzed and worked upon.
- Another example of quantitative research is an organization that conducts an event, collecting feedback from attendees about the value they see from the event. By using an event survey , the organization can collect actionable feedback about the satisfaction levels of customers during various phases of the event such as the sales, pre and post-event, the likelihood of recommending the organization to their friends and colleagues, hotel preferences for the future events and other such questions.
What are the Advantages of Quantitative Research?
There are many advantages to quantitative research. Some of the major advantages of why researchers use this method in market research are:

Collect Reliable and Accurate Data:
Quantitative research is a powerful method for collecting reliable and accurate quantitative data. Since data is collected, analyzed, and presented in numbers, the results obtained are incredibly reliable and objective. Numbers do not lie and offer an honest and precise picture of the conducted research without discrepancies. In situations where a researcher aims to eliminate bias and predict potential conflicts, quantitative research is the method of choice.
Quick Data Collection:
Quantitative research involves studying a group of people representing a larger population. Researchers use a survey or another quantitative research method to efficiently gather information from these participants, making the process of analyzing the data and identifying patterns faster and more manageable through the use of statistical analysis. This advantage makes quantitative research an attractive option for projects with time constraints.
Wider Scope of Data Analysis:
Quantitative research, thanks to its utilization of statistical methods, offers an extensive range of data collection and analysis. Researchers can delve into a broader spectrum of variables and relationships within the data, enabling a more thorough comprehension of the subject under investigation. This expanded scope is precious when dealing with complex research questions that require in-depth numerical analysis.
Eliminate Bias:
One of the significant advantages of quantitative research is its ability to eliminate bias. This research method leaves no room for personal comments or the biasing of results, as the findings are presented in numerical form. This objectivity makes the results fair and reliable in most cases, reducing the potential for researcher bias or subjectivity.
In summary, quantitative research involves collecting, analyzing, and presenting quantitative data using statistical analysis. It offers numerous advantages, including the collection of reliable and accurate data, quick data collection, a broader scope of data analysis, and the elimination of bias, making it a valuable approach in the field of research. When considering the benefits of quantitative research, it’s essential to recognize its strengths in contrast to qualitative methods and its role in collecting and analyzing numerical data for a more comprehensive understanding of research topics.
Best Practices to Conduct Quantitative Research
Here are some best practices for conducting quantitative research:

- Differentiate between quantitative and qualitative: Understand the difference between the two methodologies and apply the one that suits your needs best.
- Choose a suitable sample size: Ensure that you have a sample representative of your population and large enough to be statistically weighty.
- Keep your research goals clear and concise: Know your research goals before you begin data collection to ensure you collect the right amount and the right quantity of data.
- Keep the questions simple: Remember that you will be reaching out to a demographically wide audience. Pose simple questions for your respondents to understand easily.
Quantitative Research vs Qualitative Research
Quantitative research and qualitative research are two distinct approaches to conducting research, each with its own set of methods and objectives. Here’s a comparison of the two:

Quantitative Research
- Objective: The primary goal of quantitative research is to quantify and measure phenomena by collecting numerical data. It aims to test hypotheses, establish patterns, and generalize findings to a larger population.
- Data Collection: Quantitative research employs systematic and standardized approaches for data collection, including techniques like surveys, experiments, and observations that involve predefined variables. It is often collected from a large and representative sample.
- Data Analysis: Data is analyzed using statistical techniques, such as descriptive statistics, inferential statistics, and mathematical modeling. Researchers use statistical tests to draw conclusions and make generalizations based on numerical data.
- Sample Size: Quantitative research often involves larger sample sizes to ensure statistical significance and generalizability.
- Results: The results are typically presented in tables, charts, and statistical summaries, making them highly structured and objective.
- Generalizability: Researchers intentionally structure quantitative research to generate outcomes that can be helpful to a larger population, and they frequently seek to establish causative connections.
- Emphasis on Objectivity: Researchers aim to minimize bias and subjectivity, focusing on replicable and objective findings.
Qualitative Research
- Objective: Qualitative research seeks to gain a deeper understanding of the underlying motivations, behaviors, and experiences of individuals or groups. It explores the context and meaning of phenomena.
- Data Collection: Qualitative research employs adaptable and open-ended techniques for data collection, including methods like interviews, focus groups, observations, and content analysis. It allows participants to express their perspectives in their own words.
- Data Analysis: Data is analyzed through thematic analysis, content analysis, or grounded theory. Researchers focus on identifying patterns, themes, and insights in the data.
- Sample Size: Qualitative research typically involves smaller sample sizes due to the in-depth nature of data collection and analysis.
- Results: Findings are presented in narrative form, often in the participants’ own words. Results are subjective, context-dependent, and provide rich, detailed descriptions.
- Generalizability: Qualitative research does not aim for broad generalizability but focuses on in-depth exploration within a specific context. It provides a detailed understanding of a particular group or situation.
- Emphasis on Subjectivity: Researchers acknowledge the role of subjectivity and the researcher’s influence on the Research Process . Participant perspectives and experiences are central to the findings.
Researchers choose between quantitative and qualitative research methods based on their research objectives and the nature of the research question. Each approach has its advantages and drawbacks, and the decision between them hinges on the particular research objectives and the data needed to address research inquiries effectively.
Quantitative research is a structured way of collecting and analyzing data from various sources. Its purpose is to quantify the problem and understand its extent, seeking results that someone can project to a larger population.
Companies that use quantitative rather than qualitative research typically aim to measure magnitudes and seek objectively interpreted statistical results. So if you want to obtain quantitative data that helps you define the structured cause-and-effect relationship between the research problem and the factors, you should opt for this type of research.
At QuestionPro , we have various Best Data Collection Tools and features to conduct investigations of this type. You can create questionnaires and distribute them through our various methods. We also have sample services or various questions to guarantee the success of your study and the quality of the collected data.
Quantitative research is a systematic and structured approach to studying phenomena that involves the collection of measurable data and the application of statistical, mathematical, or computational techniques for analysis.
Quantitative research is characterized by structured tools like surveys, substantial sample sizes, closed-ended questions, reliance on prior studies, data presented numerically, and the ability to generalize findings to the broader population.
The two main methods of quantitative research are Primary quantitative research methods, involving data collection directly from sources, and Secondary quantitative research methods, which utilize existing data for analysis.
1.Surveying to measure employee engagement with numerical rating scales. 2.Analyzing sales data to identify trends in product demand and market share. 4.Examining test scores to assess the impact of a new teaching method on student performance. 4.Using website analytics to track user behavior and conversion rates for an online store.
1.Differentiate between quantitative and qualitative approaches. 2.Choose a representative sample size. 3.Define clear research goals before data collection. 4.Use simple and easily understandable survey questions.
MORE LIKE THIS

Jotform vs SurveyMonkey: Which Is Best in 2024
Aug 15, 2024
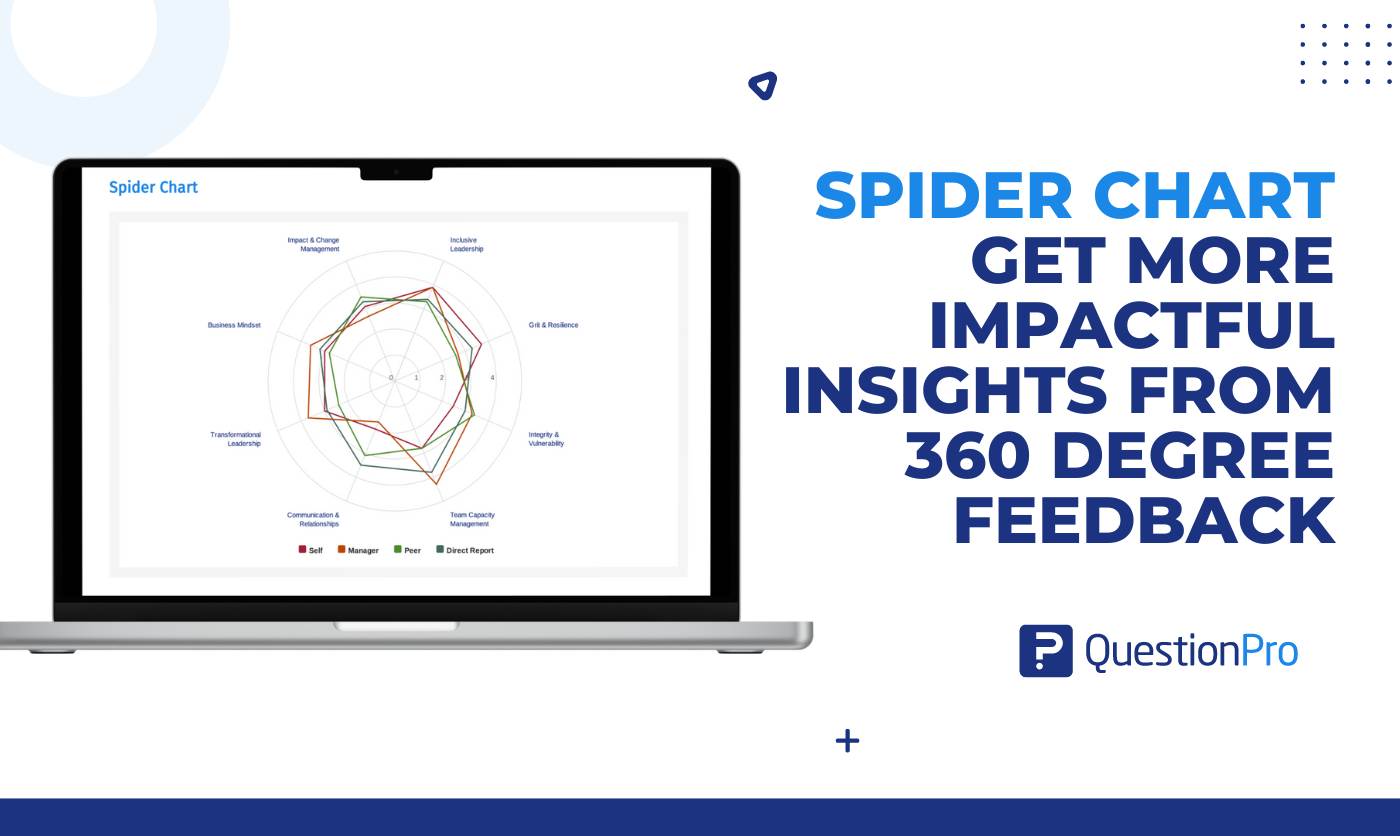
360 Degree Feedback Spider Chart is Back!
Aug 14, 2024

Jotform vs Wufoo: Comparison of Features and Prices
Aug 13, 2024

Product or Service: Which is More Important? — Tuesday CX Thoughts
Other categories.
- Academic Research
- Artificial Intelligence
- Assessments
- Brand Awareness
- Case Studies
- Communities
- Consumer Insights
- Customer effort score
- Customer Engagement
- Customer Experience
- Customer Loyalty
- Customer Research
- Customer Satisfaction
- Employee Benefits
- Employee Engagement
- Employee Retention
- Friday Five
- General Data Protection Regulation
- Insights Hub
- Life@QuestionPro
- Market Research
- Mobile diaries
- Mobile Surveys
- New Features
- Online Communities
- Question Types
- Questionnaire
- QuestionPro Products
- Release Notes
- Research Tools and Apps
- Revenue at Risk
- Survey Templates
- Training Tips
- Tuesday CX Thoughts (TCXT)
- Uncategorized
- What’s Coming Up
- Workforce Intelligence
Have a language expert improve your writing
Run a free plagiarism check in 10 minutes, generate accurate citations for free.
- Knowledge Base
Methodology
- Qualitative vs. Quantitative Research | Differences, Examples & Methods
Qualitative vs. Quantitative Research | Differences, Examples & Methods
Published on April 12, 2019 by Raimo Streefkerk . Revised on June 22, 2023.
When collecting and analyzing data, quantitative research deals with numbers and statistics, while qualitative research deals with words and meanings. Both are important for gaining different kinds of knowledge.
Common quantitative methods include experiments, observations recorded as numbers, and surveys with closed-ended questions.
Quantitative research is at risk for research biases including information bias , omitted variable bias , sampling bias , or selection bias . Qualitative research Qualitative research is expressed in words . It is used to understand concepts, thoughts or experiences. This type of research enables you to gather in-depth insights on topics that are not well understood.
Common qualitative methods include interviews with open-ended questions, observations described in words, and literature reviews that explore concepts and theories.
Table of contents
The differences between quantitative and qualitative research, data collection methods, when to use qualitative vs. quantitative research, how to analyze qualitative and quantitative data, other interesting articles, frequently asked questions about qualitative and quantitative research.
Quantitative and qualitative research use different research methods to collect and analyze data, and they allow you to answer different kinds of research questions.

Quantitative and qualitative data can be collected using various methods. It is important to use a data collection method that will help answer your research question(s).
Many data collection methods can be either qualitative or quantitative. For example, in surveys, observational studies or case studies , your data can be represented as numbers (e.g., using rating scales or counting frequencies) or as words (e.g., with open-ended questions or descriptions of what you observe).
However, some methods are more commonly used in one type or the other.
Quantitative data collection methods
- Surveys : List of closed or multiple choice questions that is distributed to a sample (online, in person, or over the phone).
- Experiments : Situation in which different types of variables are controlled and manipulated to establish cause-and-effect relationships.
- Observations : Observing subjects in a natural environment where variables can’t be controlled.
Qualitative data collection methods
- Interviews : Asking open-ended questions verbally to respondents.
- Focus groups : Discussion among a group of people about a topic to gather opinions that can be used for further research.
- Ethnography : Participating in a community or organization for an extended period of time to closely observe culture and behavior.
- Literature review : Survey of published works by other authors.
A rule of thumb for deciding whether to use qualitative or quantitative data is:
- Use quantitative research if you want to confirm or test something (a theory or hypothesis )
- Use qualitative research if you want to understand something (concepts, thoughts, experiences)
For most research topics you can choose a qualitative, quantitative or mixed methods approach . Which type you choose depends on, among other things, whether you’re taking an inductive vs. deductive research approach ; your research question(s) ; whether you’re doing experimental , correlational , or descriptive research ; and practical considerations such as time, money, availability of data, and access to respondents.
Quantitative research approach
You survey 300 students at your university and ask them questions such as: “on a scale from 1-5, how satisfied are your with your professors?”
You can perform statistical analysis on the data and draw conclusions such as: “on average students rated their professors 4.4”.
Qualitative research approach
You conduct in-depth interviews with 15 students and ask them open-ended questions such as: “How satisfied are you with your studies?”, “What is the most positive aspect of your study program?” and “What can be done to improve the study program?”
Based on the answers you get you can ask follow-up questions to clarify things. You transcribe all interviews using transcription software and try to find commonalities and patterns.
Mixed methods approach
You conduct interviews to find out how satisfied students are with their studies. Through open-ended questions you learn things you never thought about before and gain new insights. Later, you use a survey to test these insights on a larger scale.
It’s also possible to start with a survey to find out the overall trends, followed by interviews to better understand the reasons behind the trends.
Qualitative or quantitative data by itself can’t prove or demonstrate anything, but has to be analyzed to show its meaning in relation to the research questions. The method of analysis differs for each type of data.
Analyzing quantitative data
Quantitative data is based on numbers. Simple math or more advanced statistical analysis is used to discover commonalities or patterns in the data. The results are often reported in graphs and tables.
Applications such as Excel, SPSS, or R can be used to calculate things like:
- Average scores ( means )
- The number of times a particular answer was given
- The correlation or causation between two or more variables
- The reliability and validity of the results
Analyzing qualitative data
Qualitative data is more difficult to analyze than quantitative data. It consists of text, images or videos instead of numbers.
Some common approaches to analyzing qualitative data include:
- Qualitative content analysis : Tracking the occurrence, position and meaning of words or phrases
- Thematic analysis : Closely examining the data to identify the main themes and patterns
- Discourse analysis : Studying how communication works in social contexts
If you want to know more about statistics , methodology , or research bias , make sure to check out some of our other articles with explanations and examples.
- Chi square goodness of fit test
- Degrees of freedom
- Null hypothesis
- Discourse analysis
- Control groups
- Mixed methods research
- Non-probability sampling
- Quantitative research
- Inclusion and exclusion criteria
Research bias
- Rosenthal effect
- Implicit bias
- Cognitive bias
- Selection bias
- Negativity bias
- Status quo bias
Quantitative research deals with numbers and statistics, while qualitative research deals with words and meanings.
Quantitative methods allow you to systematically measure variables and test hypotheses . Qualitative methods allow you to explore concepts and experiences in more detail.
In mixed methods research , you use both qualitative and quantitative data collection and analysis methods to answer your research question .
The research methods you use depend on the type of data you need to answer your research question .
- If you want to measure something or test a hypothesis , use quantitative methods . If you want to explore ideas, thoughts and meanings, use qualitative methods .
- If you want to analyze a large amount of readily-available data, use secondary data. If you want data specific to your purposes with control over how it is generated, collect primary data.
- If you want to establish cause-and-effect relationships between variables , use experimental methods. If you want to understand the characteristics of a research subject, use descriptive methods.
Data collection is the systematic process by which observations or measurements are gathered in research. It is used in many different contexts by academics, governments, businesses, and other organizations.
There are various approaches to qualitative data analysis , but they all share five steps in common:
- Prepare and organize your data.
- Review and explore your data.
- Develop a data coding system.
- Assign codes to the data.
- Identify recurring themes.
The specifics of each step depend on the focus of the analysis. Some common approaches include textual analysis , thematic analysis , and discourse analysis .
A research project is an academic, scientific, or professional undertaking to answer a research question . Research projects can take many forms, such as qualitative or quantitative , descriptive , longitudinal , experimental , or correlational . What kind of research approach you choose will depend on your topic.
Cite this Scribbr article
If you want to cite this source, you can copy and paste the citation or click the “Cite this Scribbr article” button to automatically add the citation to our free Citation Generator.
Streefkerk, R. (2023, June 22). Qualitative vs. Quantitative Research | Differences, Examples & Methods. Scribbr. Retrieved August 16, 2024, from https://www.scribbr.com/methodology/qualitative-quantitative-research/
Is this article helpful?

Raimo Streefkerk
Other students also liked, what is quantitative research | definition, uses & methods, what is qualitative research | methods & examples, mixed methods research | definition, guide & examples, get unlimited documents corrected.
✔ Free APA citation check included ✔ Unlimited document corrections ✔ Specialized in correcting academic texts
- Business & Money
- Marketing & Sales
Sorry, there was a problem.
Download the free Kindle app and start reading Kindle books instantly on your smartphone, tablet, or computer - no Kindle device required .
Read instantly on your browser with Kindle for Web.
Using your mobile phone camera - scan the code below and download the Kindle app.

Image Unavailable

- To view this video download Flash Player
Marketing Research Methods: Quantitative and Qualitative Approaches
- ISBN-10 1108834981
- ISBN-13 978-1108834988
- Publisher Cambridge University Press
- Publication date March 11, 2021
- Language English
- Dimensions 7.5 x 1.75 x 9.75 inches
- Print length 882 pages
- See all details
Products related to this item

Editorial Reviews
Book description, about the author, product details.
- Publisher : Cambridge University Press (March 11, 2021)
- Language : English
- Hardcover : 882 pages
- ISBN-10 : 1108834981
- ISBN-13 : 978-1108834988
- Item Weight : 4.4 pounds
- Dimensions : 7.5 x 1.75 x 9.75 inches
- #3,324 in Market Research Business (Books)
- #6,853 in Social Sciences Research
- #124,412 in Social Sciences (Books)

Customer reviews
- 5 star 4 star 3 star 2 star 1 star 5 star 81% 19% 0% 0% 0% 81%
- 5 star 4 star 3 star 2 star 1 star 4 star 81% 19% 0% 0% 0% 19%
- 5 star 4 star 3 star 2 star 1 star 3 star 81% 19% 0% 0% 0% 0%
- 5 star 4 star 3 star 2 star 1 star 2 star 81% 19% 0% 0% 0% 0%
- 5 star 4 star 3 star 2 star 1 star 1 star 81% 19% 0% 0% 0% 0%
Customer Reviews, including Product Star Ratings help customers to learn more about the product and decide whether it is the right product for them.
To calculate the overall star rating and percentage breakdown by star, we don’t use a simple average. Instead, our system considers things like how recent a review is and if the reviewer bought the item on Amazon. It also analyzed reviews to verify trustworthiness.
No customer reviews
- About Amazon
- Investor Relations
- Amazon Devices
- Amazon Science
- Sell products on Amazon
- Sell on Amazon Business
- Sell apps on Amazon
- Become an Affiliate
- Advertise Your Products
- Self-Publish with Us
- Host an Amazon Hub
- › See More Make Money with Us
- Amazon Business Card
- Shop with Points
- Reload Your Balance
- Amazon Currency Converter
- Amazon and COVID-19
- Your Account
- Your Orders
- Shipping Rates & Policies
- Returns & Replacements
- Manage Your Content and Devices
- Conditions of Use
- Privacy Notice
- Consumer Health Data Privacy Disclosure
- Your Ads Privacy Choices
LIFE EXPERIENCES OF YOUNG MINNESOTANS WITH MARGINALIZED IDENTITIES
Intersectionality study iii, quantitative research report.
7 AUGUST 2024
Research conducted by,MarketResponse International Project #2526 For the Minnesota Governor's Councilon Developmental Disabilities
Table of Contents
- Research Overview
Research Method
- Respondent Profile
- Executive Summary
- Detailed Findings
- Measures of Discrimination
- Feelings Out In The Community
- Intersectionality Impacts
- Discrimination Experiences
Multi-phased Intersectionality Studies are focused on the intersection of developmental disabilities with race and ethnicity and other marginalized communities, which leads to social discrimination and disparities in areas such as:
- Health Care
- Social Services (home and community-based services)
Phase I: Qualitative research completed in August 2022
- Literature review
- Internal Qualitative Interviews
- Narrative Research Focus Groups and 1:1 Interviews (n=49)
- Was designed to gain insights regarding:
- The nature of discrimination and all its forms
- How it is experienced by various groups with intersecting profiles
- Impacts and results, both short-term and long-term
Phase II: Benchmark Quantitative survey completed in September 2023 was designed to gain comparative measures of various forms of discrimination among four populations (n=593):
- White people with disabilities
- Black, indigenous, (and other) people of color (BIPOC*) with disabilities
- White people without disabilities
- BIPOC without disabilities
* We are using the term BIPOC to represent all non-white racial and ethnic communities included in this study
Phase III: Quantitative and Qualitative research completed in July 2024 is focused on young Minnesotans (ages 13-22), to better understand their life experiences and the extent to which those with marginalized identities feel included in the One Minnesota promise of diversity, equity and inclusion. This pilot study provides preliminary measures (n=261), which can help inform the design and fielding of a future potential statewide survey of young Minnesotans.
Quantitative Survey of Young Minnesotans
Included 9-12th grades and transition program students, ages 13-22
Two groups were identified, based on disability status:
1. No Disability (control sample) n=176
2. Have a disability n=57 or Parent (assisting child respondent with a disability n=28 Total Disability Sample: n=85 (55% reported as a developmental disability)
TOTAL n=261
The quantitative survey was administered through two methods:
1) Commercial opt-in online panel, used primarily to recruit young persons without disabilities from all around the State of Minnesota.
2) Young Minnesotans with developmental and other disabilities were included in the survey with help from state agencies
A qualitative Online Community was conducted among a sampling of respondents with disabilities who participated in the online survey
n=7 around the state of Minnesota, 2 weeks duration
YOUTH RESPONDENT PROFILE
With 70% White, Caucasian, and 30% BIPOC, the survey sample closely matched the diversity of the general population of young Minnesotans.*
* SOURCE: Exploring Age Groups in the 2020 Census, learn about age, sex, and racial and ethnic diversity for states, counties, and census tracts
We are using the term BIPOC to represent all nonwhite communities included in this study.
Our sample of young Minnesotans had good representation by age and gender:**
Age and Gender (n=256)
Age Age 13-17, 44% Age 18-22, 54%
Gender 47% Male 52% Female
Age and Gender Female 13-17 18% Male 13-17 26% Female 18-22 33% Male 18-22 21%
**Data does not add up to 100% due to rounding and 2% self reporting as non-binary.
Race, Ethnicity (n=261)
White, Caucasian 70% BIPOC See below breakdown - Total 30% Black, African American, Born in the US 9% Other Asian or Pacific Islander 5% Hispanic or Latino 5% Two or more (non-white) races 3% American Indian or Alaska Native 3% Southeast Asian - Hmong 3% Other 1% Black, Immigrant, Born outside the US 1%
RESPONDENT PROFILE - DISABILITY STATUS
Disability Status (n=261)
Parent advocate 11% Have a disability 22% No disability 67%
Type of Disability (n=85) of those with a disability 55% were developmental disabilities
Developmental Disability 55% Other Disability 28% Don't know 16%
Nature of Disability
Autism 38% Cognitive or Intellectual disability 36% Mental Health 34% A condition that limits one or more physical activities 14% Epilepsy 8% Down syndrome 8% Blindness or low vision 8% Hard of hearing 6% Deaf 1% DeafBlind 0 Other 24% Unsure, I really don't know 4%
EXECUTIVE SUMMARY
A DIFFERENT REALITY FOR YOUNG PEOPLE WITH DISABILITIES - Twice as many incidences of discrimination were experienced by Minnesota teens and young adults with disabilities, as compared to youth without disabilities.
The young respondents selected words that best describe the way they typically feel when they are out and about and interacting with other people in their community. Words selected most often reveal very different perceptions among young people with disabilities, as compared to those without disabilities.
The TOP 5 WORDS selected by . . .
Young people WITHOUT disabilities:
Friendly Anxious At Ease Confident Accepted
Young people WITH disabilities:
Friendly Anxious Misunderstood Excluded Frustrated
EXECUTIVE SUMMARY - Intersectionality Impacts
Impact of the intersection between disability and race and ethnicity:
BIPOC teens and young adults WITHOUT disabilities experience twice as many incidences of discrimination, as compared to white youth without disabilities.
For both white and BIPOC teens and young adults, having a disability greatly increases the likelihood of experiencing discrimination.
The relative amounts of reported discrimination experiences were highest among young white Minnesotans with disabilities, as compared to the BIPOC youth with disabilities.
There was a similar finding from The One Minnesota Baseline Quantitative Survey among Minnesota adults, completed in September 2023. (Our project #2508)
We believe these similar findings from both studies are indications of a loss of privilege impact that is possibly more noticed and experienced by white people with disabilities, as compared to BIPOC with disabilities.
Note: Privilege is a special right, advantage or immunity granted or available only to particular individuals or groups. (Oxford Languages) In the original intersectionality study completed August 2022, we surmised that discrimination happens in the absense of privelege.
EXECUTIVE SUMMARY - Satisfaction in the Community
White people with disabilities are more than twice as likely to be dissatisfied with how they are treated, included, and accepted in their communities, as compared to BIPOC youth, with or without disabilities.
Question asked: All things considered, how satisfied are you with the way you are treated, included, and accepted by your community as a whole?
White WITHOUT Disability (n=123)
Total Dissatisfied 6% (Somewhat dissatisfied 4% Very dissatisfied 2%) Total Satisfied 77% (Somewhat satisfied 53% Very satisfied 24%)
BIPOC WITHOUT Disability (n=53)
Total Dissatisfied 12% (Somewhat dissatisfied 8% Very dissatisfied 4%) Total Satisfied 64% (Somewhat satisfied 45% Very satisfied 1%)
White WITH Disability (n=58)
Total Dissatisfied 26% (Somewhat dissatisfied 17% Very dissatisfied 9%) Total Satisfied 48% (Somewhat satisfied 38% Very satisfied 10%)
BIPOC WITH Disability (n=26)
Total Dissatisfied 12% (Somewhat dissatisfied 4% Very dissatisfied 8%) Total Satisfied 66% (Somewhat satisfied 54% Very satisfied 12%)
EXECUTIVE SUMMARY - Discrimination Experiences
When describing their discrimination experiences, including unfair treatment, barriers to products or services, or restrictions from privileges, the following top six themes emerged.
White WITHOUT Disability (n=48) BIPOC WITHOUT Disability (n=33) White WITH Disability (n=46) BIPOC WITH Disability (n=17)
Social Exclusion, Favoritism, and Bullying
White WITHOUT Disability 17% BIPOC WITHOUT Disability 24% White WITH Disability 35% BIPOC WITH Disability 35%
Inadequate Support Services for People with Disabilities
White WITHOUT Disability 6% BIPOC WITHOUT Disability 6% White WITH Disability 46% BIPOC WITH Disability 18%
Disability Discrimination in Education
White WITHOUT Disability 4% BIPOC WITHOUT Disability 3% White WITH Disability 28% BIPOC WITH Disability 24%
Workplace Discrimination
White WITHOUT Disability 15% BIPOC WITHOUT Disability 15% White WITH Disability 9% BIPOC WITH Disability 18%
Racial Discrimination
White WITHOUT Disability 6% BIPOC WITHOUT Disability 33% White WITH Disability 0% BIPOC WITH Disability 6%
Healthcare Discrimination
White WITHOUT Disability 8% BIPOC WITHOUT Disability 3% White WITH Disability 11% BIPOC WITH Disability 12%
To improve the lives of young Minnesotans with disabilities, the State would need to better understand the issues - and provide solutions related to - support services for disabilities, discrimination in education, and workplace and healthcare discrimination.
Note: Differences of 20% or more, between groups with sample sizes greater than 30, are likely to be statistically significant at the 90% level or greater.
DETAILED FINDINGS
Achieving the One Minnesota promise is synonymous with eliminating discriminatory behaviors and barriers that limit the possibility for people to achieve their full potential.
Discrimination is the act of making unjustified distinctions between people based on the groups, classes, or other categories to which they belong or are perceived to belong.
Occurs when individuals or groups are unfairly treated in a way which is worse than other people are treated.
Or when barriers or obstacles to needed products or services exist for some people but not for others.
Or when members of one group are restricted from opportunities or privileges that are available to members of another group.
MEASURES OF DISCRIMINATION
The three questions used to measure incidences of discrimination are shown here. Adding up the YES percents from the three questions yields a total discrimination index for each group.
Within the past 12 months, do you believe you....
Were restricted from opportunities, privileges or activities Encountered barriers or obstacles to needed products or services Were unfairly treated, worse than others are treated
TOTAL WITHOUT Disability (n=176) Discrimination index 71
Were restricted from opportunities, privileges or activities - 19% Encountered barriers or obstacles to needed products or services - 20% Were unfairly treated, worse than others are treated - 32%
TOTAL WITH Disability (n=85) Discrimination index 154
Were restricted from opportunities, privileges or activities - 54% Encountered barriers or obstacles to needed products or services - 51% Were unfairly treated, worse than others are treated - 49%
As shown, twice as many incidences of discrimination were experienced by Minnesota teens and young adults with disabilities, as compared to youth without disabilities.
HOW THE YOUTH FEEL IN THEIR COMMUNITY
The young Minnesotans were asked to select the few words that best describe the way they typically feel when they are out and about and interacting with other people in their community.
Without a disability (n=176)
Four of the top 5 most selected words by those who do not have a disability were all positive. (The exception is the word Anxious.)
Friendly 44% Anxious 33% At ease 31% Confident 24% Accepted 19% Misunderstood 15% Invisible 14% Respected 13% Valued 13% Frustrated 10% Excluded 9% Fearful 4%
With a disability (n=85)
Four of the top 5 most selected words by the young Minnesotans with disabilities were negative: Anxious, Misunderstood, Excluded, Frustrated
Friendly 33% Anxious 39% At ease 13% Confident 12% Accepted 15% Misunderstood 34% Invisible 15% Respected 14% Valued 9% Frustrated 21% Excluded 27% Fearful 11%
INTERSECTIONALITY IMPACTS - Disability and Ethnicity
BIPOC teens and young adults WITHOUT disabilities experience twice as many incidences of discrimination, as compared to white youth WITHOUT disabilities.
White youth with disabilities experienced the highest number of discrimination incidences.
White WITHOUT Disability (n=123) Discrimination index 56
Were restricted from opportunities, privileges or activities - 15% Encountered barriers or obstacles to needed products or services - 15% Were unfairly treated, worse than others are treated - 26%
BIPOC WITHOUT Disability (n=53) Discrimination index 107
Were restricted from opportunities, privileges or activities - 28% Encountered barriers or obstacles to needed products or services - 32% Were unfairly treated, worse than others are treated - 47%
White WITH Disability (n=58) Discrimination index 158
Were restricted from opportunities, privileges or activities - 53% Encountered barriers or obstacles to needed products or services - 57% Were unfairly treated, worse than others are treated - 48%
BIPOC WITH Disability (n=26*) Discrimination index 142
Were restricted from opportunities, privileges or activities - 54% Encountered barriers or obstacles to needed products or services - 38% Were unfairly treated, worse than others are treated - 50%
* Given the relatively small sample size of n=26, caution is advised in making statistical inferences to the population of young BIPOC Minnesotans with disabilities.
INTERSECTIONALITY IMPACTS - How Youth Feel in their Communities
The teens and young adults from the four groups selected words that best describe the way they typically feel when they are out and about and interacting with other people in their community.
Positive Words
Friendly 45% At Ease 36% Confident 24% Accepted 22% Respected 15%
NEGATIVE Words
Anxious 29% Misunderstood 11% Frustrated 8% Excluded 8% Fearful 2%
Friendly 43% At Ease 21% Confident 25% Accepted 13% Respected 8%
Anxious 42% Misunderstood 23% Frustrated 13% Excluded 9% Fearful 8%
Friendly 34% At Ease 16% Confident 7% Accepted 16% Respected 10%
Anxious 41% Misunderstood 33% Frustrated 21% Excluded 29% Fearful 7%
BIPOC WITH Disability (n=26*)
* Given the relatively small sample size of n=26, caution is advised in making statistical inferences to the population of young BIPOC Minnesotans with disabilities. Positive Words
Friendly 31% At Ease 8% Confident 23% Accepted 15% Respected 23%
Anxious 35% Misunderstood 38% Frustrated 19% Excluded 23% Fearful 19%
BIPOC youth with disabilities appear to be least likely to feel at ease in their communities.
White youth with disabilities appear least likely to feel confident.
Fearful was selected by one of five BIPOC with disabilities, substantially more than any other group.
Note: Differences of 15% or more, between groups with sample sizes greater than 50, are likely to be statistically significant at the 90% level or greater.
DISCRIMINATION EXPERIENCES
The teens and young adults were asked to describe a time when they felt as though they were unfairly treated, or there were barriers to needed products or services, or they were restricted from privileges or activities. Their responses were coded as follows:The teens and young adults were asked to describe a time when they felt as though they were unfairly treated, or there were barriers to needed products or services, or they were restricted from privileges or activities. Their responses were coded as follows:
TOTAL (n=145)
Social Exclusion and Bullying 26% Inadequate Support Services for Disabilities 20% Disability Discrimination in Education 14% Workplace Discrimination 13% Racial Discrimination 10% Healthcare Discrimination 8% Inequality in Education Opportunities 6% Discrimination in Sports 6% Sexual Orientation Discrimination 3% Pregnancy Discrimination 1%
White WITHOUT Disability (n=48)
Social Exclusion and Bullying 17% Inadequate Support Services for Disabilities 6% Disability Discrimination in Education 4% Workplace Discrimination 15% Racial Discrimination 6% Healthcare Discrimination 8% Inequality in Education Opportunities 8% Discrimination in Sports 8% Sexual Orientation Discrimination 4% Pregnancy Discrimination 4%
BIPOC WITHOUT Disability (n=33)
Social Exclusion and Bullying 24% Inadequate Support Services for Disabilities 6% Disability Discrimination in Education 3% Workplace Discrimination 15% Racial Discrimination 33% Healthcare Discrimination 3% Inequality in Education Opportunities 3% Discrimination in Sports 3% Sexual Orientation Discrimination 3% Pregnancy Discrimination 0%
White WITH Disability (n=46)
Social Exclusion and Bullying 35% Inadequate Support Services for Disabilities 46% Disability Discrimination in Education 28% Workplace Discrimination 9% Racial Discrimination 0% Healthcare Discrimination 11% Inequality in Education Opportunities 7% Discrimination in Sports 7% Sexual Orientation Discrimination 2% Pregnancy Discrimination 0%
BIPOC WITH Disability (n=17)
Social Exclusion and Bullying 35% Inadequate Support Services for Disabilities 18% Disability Discrimination in Education 24% Workplace Discrimination 18% Racial Discrimination 6% Healthcare Discrimination 12% Inequality in Education Opportunities 0% Discrimination in Sports 0% Sexual Orientation Discrimination 0% Pregnancy Discrimination 0%
DISCRIMINATION EXPERIENCES: White Without Disabilities
Thirty-nine percent (39%) of young white Minnesotans without disabilities reported having any discrimination experiences. Some examples of those experiences are shown below under two general themes.
Our school only celebrates and encourages boys, not the girl athletes and smart kids. It makes me mad. I have a 4.0 GPA, but it doesn't matter if you're a girl: the school doesn't celebrate us. Just the boys. It's hurtful. In school I feel that they are not helpful for students that are at the bottom, and they didn't care if I succeed. I would go to them for extra help or support in certain classes and they didn't help in any way. Kids pick on me for wearing hand me downs. In baseball the coach plays favorites with kids that pay to go to his program outside of school & put them on teams above where they should play. Most cannot afford the outside program. It frustrates them & makes them want to quit the program.
At work, I was sexually harassed by another coworker and when I told HR, they did not care. This made me feel like I was treated very unfairly. It honestly made me feel like I was not respected because it was an ethical issue. I wanted to quit, and I still do. At work, I was more harshly judged because of my age and pregnancy. I was upset and I feel like I stopped trying as hard to be successful at my job. I feel that in my workplace, I am often looked down upon because I am young. I often am not able to lead in the same way my coworkers can even though they are only a few years older than me. It makes me feel frustrated. I feel that age does not define how hard one works. This affects my work because I become self-conscious in my decisions after not being able to participate in the same activities as my older coworkers.
DISCRIMINATION EXPERIENCES: BIPOC Without Disabilities
Sixty-two percent (62%) of BIPOC without disabilities have experienced discrimination. Various forms of racial discrimination were most often described.
My younger brother and I moved to a small town. Because we are part of a very small African American group, I feel things are harder, or people shun us because of our skin color, or maybe it's just the fact that we are young. I feel as though they see young gang members coming to cause trouble, when we are actually just young adults trying to survive. I was shopping for something, and no one came up to me. But then a white girl came in and the store workers were quick to greet and help her. Being Asian I couldn't hangout with my white friends because of their mom being mean to me and thinking I wasn't good enough. I was restricted from a group in my church because I was a black person. It made me feel sad, and very angry. I was at work, and they were being really racist and rude. They called me the N word.
I'm not considered part of the group or circle. I was treated with warmth in front of the public, but not behind the public, I'm nothing. My mom warned me about being careful trusting and hanging out with people. She is right. I don't get to walk with them. I can't sit with them. I was a new kid in school this year & after we moved it has been difficult for me to make friends and get involved in stuff. I suffer from anxiety, and it plays a big role in me making friends or doing normal kid stuff. I just don't want to be at school; there isn't anything to look forward to. I was bullied by my peers for cutting my hair short; kids teased me and called me trans.
DISCRIMINATION EXPERIENCES: White WITH Disabilities (n=46)
Among young white Minnesotans WITH disabilities, 79% reported experiences with discrimination, examples of which are shown below under four general themes.
Inadequate Support Services for Disabilities
Living in northwest Minnesota creates a barrier to needed services for an individual 18-22 with disabilities, because of the lack of availability. There are limited resources and opportunities for individuals with disabilities living in greater Minnesota. We lack supportive employment and meaningful transition programs. Individuals with disabilities lack community and leisure opportunities. At a minimum, our smaller schools struggle to provide level 3 settings for those students with higher needs. Within our region, our students do not have access to a Level IV facility. Currently, the nearest facility is over 100 miles away. That is not equity in education! I haven't been able to have PCA services due to not being recognized as disabled. It took almost 3 months to get a MN Choices assessment scheduled after a 3-year battle for SSDI certification. My disability wasn't recognized, I felt like I didn't matter. At my school, they told me my diagnosis wasn't "valid" because I got it from a Primary Care Physician not a specialist. I have been on the wait list to get my diagnosis confirmed by a specialist for 7 years. This loophole allowed them to not give me any accommodations at school. It made me feel like my education was not a priority and they wanted easy students and money rather than using resources to help people. I rely on services provided by waivers. Every year we have to answer the same questions about my disability just to access needed services, and it gets old. It is unfair because my condition and supports aren't going to change a lot from year to year. I need help with basic daily living activities. Each year it seems like I have to prove it over and over again just to maintain my current level of services.
Others in my education program were allowed to use video or remote learning option on days where I wasn't physically able to be present due to my disability, but I was denied that option despite meetings and advocating. Frustrated, hopeless, depressed, I felt there was lost opportunities and time to work on my growth, development, goals for my future. I have a processing speed deficit. There have been instances where I am not given the same respect when I need more time on an exam. Jokes are made towards me and a bit from teachers such as making snore noises, or jokes about how it takes me years to finish.
It is hard for me to pay attention for long periods of time, and it takes me longer to do bigger tasks. I do not get as good of marks as others in my class do. My peers get frustrated with me, and I feel like the teachers score me lower because of it. Due to mental health, I struggle with anxiety and have a hard time being around groups of people. The school wasn't always willing to help with accommodation that made it tolerable to attend school. I ended up missing several days of school for the year and the school secretary marked the days missed as unexcused and I ended up with truancy.
Wealth (or lack thereof) makes getting proper healthcare difficult. I can't afford it. There have been times when my son was overshadowed in the medical community because of his Down syndrome. There has been an institutional bias against some folks with Down syndrome. When physicians aren't sure what the person's diagnosis is, they say: "It's just part of Down syndrome." They do not look into the causes, nor do they do diagnostic testing to make an informed decision about the patient's symptoms.
DISCRIMINATION EXPERIENCES: BIPOC WITH Disabilities (n=17)
Among young BIPOC Minnesotans WITH disabilities, 65% reported experiences with discrimination. Some examples, in their own words, are provided below.
Social Exclusion, and Workplace Discrimination
At work I was not invited to activities because they thought my disabilities would make me not fun. It made me feel "less than," and made me look at my coworkers differently. Visiting any store and interacting with the cashier. I can't always understand what they are saying. Everyone around me gets irritated when I take too long. I get anxious and frustrated. I felt disrespected. I was treated unfairly due to my race at my old job. People assumed I didn't speak English and therefore ignored me. I was also treated unfairly by a customer due to my gender. I was threatened because I did not smile.
The education staff don't ask me relevant questions and are not providing me with transition services that address my needs and wishes for the future: to live independently in the community (with support) and be employed in the community (with appropriate supports as needed). The school has a "program" that I must "fit into." I have asked for assistive technology to support me in my transition plan. I have learned and use some assistive technology that my parents have shown me how to use, but I am not allowed or encouraged to use it at school or during my transition program. I am angry, I am supposed to be able to have the assistive technology I need to succeed, but because the school staff don't want to learn the technology, they don't provide it or even worse, they forbid me from using my phone with picture schedule app that I use at home. They say that other students can't use their phones so I can't use mine. I have always felt like I have ADHD. I expressed this to my mom, and she had countless meetings with my school and doctor, and no one would do anything or even test me. They don't want to listen or help, and I couldn't do it anymore. I dropped out my 10th grade year. Now I am a year behind in school. I started smoking weed to try to help. I was really good at track and football, and I gave it all up.
THANK YOU! From your MarketResponse team
TOM PEARSON, Managing [email protected] SUSAN McCULLOUGH, Sr. Research [email protected] LYNN SCHREIFELS, Sr. Research [email protected] DEREK PEARSON, Sr. Research [email protected]
The preparation of this document was financed in part by grant number 2301MNSCDD from the Administration for Community Living, U.S. Department of Health and Human Services, Washington, D.C. 20201. Grantees undertaking projects with government sponsorship are encouraged to express freely their findings and conclusions. Points of view or opinions do not, therefore, necessarily represent official ACL policy.
IMAGES
COMMENTS
Explore the fundamentals of quantitative market research. Learn about key methods, data collection, and how numerical analysis insights.
Quantitative Market Research is a technique to ask questions to the target audience in an organized manner using surveys, polls or questionnaires. Received responses can be analyzed to make well-thought decisions for improving products and services, that will in turn help increase respondent satisfaction levels.
Market Research: Quantitative research is used extensively in market research to understand consumer behavior, preferences, and trends. Researchers use surveys, experiments, and other quantitative methods to collect data that can inform marketing strategies, product development, and pricing decisions.
Quantitative market research is defined as a type of research that involves the collection and analysis of numerical data to understand market trends, consumer behavior, and other business-related variables. Learn more about quantitative market research methods, examples and best practices.
Quantitative marketing research is the application of quantitative research techniques to the field of marketing research. It has roots in both the positivist view of the world, and the modern marketing viewpoint that marketing is an interactive process in which both the buyer and seller reach a satisfying agreement on the "four Ps" of marketing: Product, Price, Place (location) and Promotion.
Quantitative market research collects numerical data to help answer a research question or objective. Popular forms of quantitative research include surveys, polls, questionnaires, and demographical data from primary and secondary sources. The data can be easily quantified, compared, and analyzed to establish patterns, trends, and insights that ...
The Complete Guide to Quantitative Market Research Quantitative research is a chief category in the research sphere, along with qualitative research. An encompassing aspect of market research, it can include both primary and secondary methods of extracting data.
Check out our essential guide on all things quantitative data, and how it can be leveraged by market research professionals to better understand market dynamics.
Quantitative market research is a systematic approach to gathering and analyzing data from a target market. It relies on numerical data and statistical analysis to understand consumer behavior, preferences, and trends. This method involves collecting data through structured surveys, questionnaires, and experiments conducted with a large sample ...
Quantitative market research is a research method that involves collecting numerical data that can be analyzed statistically. This method is widely used in market research to gather information about customer behavior, opinions, and preferences.
What is a quantitative research question? Quantitative market research questions tell you the what, how, when, and where of a subject. From trendspotting to identifying patterns or establishing averages- using quantitative data is a clear and effective way to start solving business problems.
What is quantitative market research, its pros and cons, and the best research methodologies. This quick guide answers all your questions.
Week 1: Assess methods available for creating quantitative surveys, along with their advantages and disadvantages. Identify the type of questions that should be asked and avoid unambiguous survey questions. Week 2: Design, test, and implement a survey by identifying the target audience and maximizing response rates.
Quantitative research is the opposite of qualitative research, which involves collecting and analyzing non-numerical data (e.g., text, video, or audio). Quantitative research is widely used in the natural and social sciences: biology, chemistry, psychology, economics, sociology, marketing, etc.
In addition, market research has clearly benefitted from applying advanced quantitative models and methods in practice. Some 60 researchers - among them worldwide leading scholars - offer a broad overview of quantitative approaches in marketing.
What marketing research methods are right for you? Here are nine of the most effective, when you should use them, and how to set them up for success.
Qualitative and Quantitative Marketing Research Methods. Some researchers take a hard approach to data, either falling squarely on the side of the numbers (quantitative data) or on the other side, one of focus groups and individual consumer feedback (qualitative data). But the richest insights come from a paired approach to research, one that ...
Delve into the advantages and disadvantages of qualitative and quantitative market research. Learn how to select the optimal research method tailored to your business's success.
Hugh Good. Quantitative research is a method of collecting numerical data that can be consistently compared and analyzed. It can be used to collect and analyze data to answer a broad range of research questions. Quantitative methods and data are used by some business owners, for example, to evaluate their business, diagnose issues, and identify ...
Learn how to compare qualitative and quantitative marketing research methods, their advantages and disadvantages, and how to use them together.
Discover the benefits of qualitative and quantitative methods. Learn how to leverage both approaches for insights into consumer behavior and industry trends.
Quantitative research is essential to developing a clear understanding of consumer engagement and how to increase satisfaction. Though online surveys are one of the most common methods for obtaining data, research isn't limited to this strategy.
What is Quantitative Research? Quantitative research is a systematic investigation of phenomena by gathering quantifiable data and performing statistical, mathematical, or computational techniques. Quantitative research collects statistically significant information from existing and potential customers using sampling methods and sending out online surveys, online polls, and questionnaires ...
When collecting and analyzing data, quantitative research deals with numbers and statistics, while qualitative research deals with words and meanings.
Covering both quantitative and qualitative methods, this book examines the breadth of modern market research methods for upper level students across business schools and social science faculties.
The MSc Quantitative Methods for Risk Management offers world-class training in mathematical, statistical, and machine learning methods for the modelling and analysis of risk in financial markets and beyond.
The quantitative survey was administered through two methods: 1) Commercial opt-in online panel, used primarily to recruit young persons without disabilities from all around the State of Minnesota. 2) Young Minnesotans with developmental and other disabilities were included in the survey with help from state agencies