.css-1qrtm5m{display:block;margin-bottom:8px;text-transform:uppercase;font-size:14px;line-height:1.5714285714285714;-webkit-letter-spacing:-0.35px;-moz-letter-spacing:-0.35px;-ms-letter-spacing:-0.35px;letter-spacing:-0.35px;font-weight:300;color:#606F7B;}@media (min-width:600px){.css-1qrtm5m{font-size:16px;line-height:1.625;-webkit-letter-spacing:-0.5px;-moz-letter-spacing:-0.5px;-ms-letter-spacing:-0.5px;letter-spacing:-0.5px;}} Best Practices The #1 rule for improving your presentation slides
by Tom Rielly • May 12, 2020

When giving presentations, either on a video conference call or in person, your slides, videos and graphics (or lack of them) can be an important element in helping you tell your story or express your idea. This is the first of a series of blog posts that will give you tips and tricks on how to perfect your visual presentations.
Your job as a presenter is to build your idea -- step-by-step -- in the minds of your audience members. One tool to do that is presentation graphics, such as slides and videos.

Why graphics for your presentation?
A common mistake is using slides or videos as a crutch, even if they don’t actually add anything to your presentation. Not all presentations need graphics. Lots of presentations work wonderfully with just one person standing on a stage telling a story, as demonstrated by many TED Talks.
You should only use slides if they serve a purpose: conveying scientific information, art, and things that are hard to explain without pictures. Once you have decided on using slides, you will have a number of decisions to make. We’ll help you with the basics of making a presentation that is, above all, clear and easy to understand. The most important thing to remember here is: less is more.
Less is so much more
You want to aim for the fewest number of slides, the fewest number of photos, the fewest words per slide, the least cluttered slides and the most white space on your slides. This is the most violated slide rule, but it is the secret to success. Take a look at these examples.

As you can see in the above example, you don’t need fancy backgrounds or extra words to convey a simple concept. If you take “Everything you need to know about Turtles”, and delete “everything you need to know about” leaving just “turtles”, the slide has become much easier for your audience to read, and tells the story with economy.
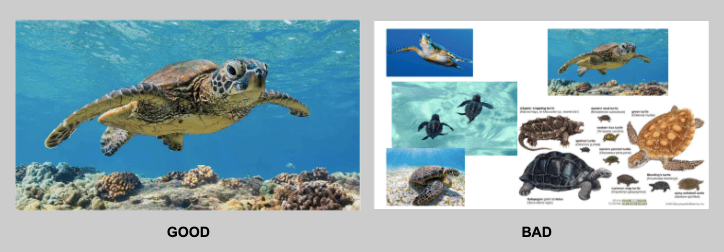
The above example demonstrates that a single image that fills the entire screen is far more powerful than a slide cluttered with images. A slide with too many images may be detrimental to your presentation. The audience will spend more mental energy trying to sort through the clutter than listening to your presentation. If you need multiple images, then put each one on its own slide. Make each image high-resolution and have it fill the entire screen. If the photos are not the same dimensions as the screen, put them on a black background. Don’t use other colors, especially white.

Your slides will be much more effective if you use the fewest words, characters, and pictures needed to tell your story. Long paragraphs make the audience strain to read them, which means they are not paying attention to you. Your audience may even get stressed if you move on to your next slide before they’ve finished reading your paragraph. The best way to make sure the attention stays on you is to limit word count to no more than 10 words per slide. As presentation expert Nancy Duarte says “any slide with more than 10 words is a document.” If you really do need a longer explanation of something, handouts or follow-up emails are the way to go.
Following a “less is more” approach is one of the simplest things you can do to improve your presentation visuals and the impact of your presentation overall. Make sure your visuals add to your presentation rather than distract from it and get your message across.
Ready to learn more about how to make your presentation even better? Get TED Masterclass and develop your ideas into TED-style talks.
© 2024 TED Conferences, LLC. All rights reserved. Please note that the TED Talks Usage policy does not apply to this content and is not subject to our creative commons license.

- Kerala PSC Exams
- Kerala PSC Notification
- Kerala PSC Exam Calender
- Kerala PSC Previous Question papers
- KAS Previous Year Question papers
- Kerala PSC VEO Notification
- Kerala Police SI
- Kerala PSC LDC Notification
- Kerala PSC LP/UP Assistant
- Kerala PSC Village Field Assistant Notification
- Kerala PSC LD Typist Notification
- Kerala PSC Food Safety Officer
- Kerala PSC Excise Inspector Notification
- Kerala PSC BDO Notification
- Kerala PSC CPO Notification
- Kerala PSC LGS Notification
- Karnataka PSC
- IBPS PO Notification
- IBPS Clerk Notification
- SBI PO Notification
- SBI Clerk Notification
- SBI SO Notification
- SBI Apprentice Notification
- Canara Bank PO Notification
- Indian Bank PO Notification
- RBI Assistant Notification
- RBI Office Attendant Notification
- IBPS RRB Notification
- IBPS RRB Office Assistant Notification
- Spoken English
- Stock Market
- Digital Marketing
- Accounting Course
- Quantity Survey
- Oil and Gas
- Structural Design
- Yoga Teaching
- Data Science Malayalam
- Data Science Training in Kochi
- Data Science Training in Trivandrum
- Data Science Course in Calicut
- Data Science Training in Thrissur
- Full Stack Development Malayalam
- Full Stack Development Hindi
- Full Stack Development Tamil
- Full Stack Development Telugu
- Full Stack Development Kannada
- Stock Market Course in Malayalam
- Stock Market Course in Tamil
- Stock Market Course in Kannada
- Options Trading Course
- Forex Trading Course in Dubai, UAE
- Spoken English Course in Malayalam
- Spoken English Course in Hindi
- Spoken English Course in Telugu
- Spoken English Course in Tamil
- Spoken English Course in Kannada
- Python Programming Course
- Software Testing Course
- AWS Solutions Architect Associate Course
- Performance Marketing Course
- Accounting Course in Malayalam
- Accounting Course in Tamil
- Tally Course
- Taxation Course
- UAE Accounting
- Zoho Books Training
- GST Practitioner Course in Kerala
- GCC VAT Course
- ACCA Course in Kerala
- SAP FICO Course
- SAP MM Course
- SAP SD Training
- SAP FICO Course in Tamil
- SAP MM Course in Tamil
- Full Stack Developer Course in Kochi
- Full Stack Developer Course in Trivandrum
- Full Stack Developer Course in Calicut
- Full Stack Developer Course in Pune
- Full Stack Developer Course in Bangalore
- Full Stack Developer Course in Hyderabad
- Full Stack Developer Course in Chennai
- Full Stack Developer Course in Indore
- Full Stack Developer Course in Jaipur
- Full Stack Developer Course in Coimbatore
- Digital Marketing Course in Kochi
- Digital Marketing Course in Trivandrum
- Digital Marketing Course in Calicut
- Digital Marketing Course in Kollam
- Digital Marketing Course in Thrissur
- Digital Marketing Course in Kottayam
- Digital Marketing Course in Kannur
- Quantity Surveying Course
- Structural Design Course
- BIM Course in Kerala
- MEP Course in Kochi
- Quantity Surveyor Course in Tamil
- Quantity Surveying Course in Telugu
- Quantity Surveyor Course in Hyderabad
- Quantity Surveying Course in Chennai
- MEP Design Course in Kerala
- HVAC Course
- Steel Structure Design Course
- RCC Design Course
- Oil and Gas Course
- Oil and Gas Course in Kerala
- Oil and Gas Course in Kochi
- Montessori Teacher Training in Calicut
- Montessori Teacher Training in Kochi, Ernakulam
- Montessori Teacher Training in Trivandrum
- Montessori Teacher Training in Kollam
- Montessori Teacher Training in Malayalam
- Montessori Teacher Training in Kannada
- German Language Course
- OET for Pharmacist
- OET for Nurses
- MOH Exam Coaching
- Nurses Recruitment Abroad
- FMGE Coaching
- ChatGPT Course
- Forex Trading Course
- Yoga Teacher Training Course
- Diploma in Early Childhood Care and Education
- Business Administration & Hospital Management Course
- Hospital and Healthcare Administration
- RRB Technician Notification
- RRB JE Notification
- RRB ALP Notification
- RRB NTPC Notification
- RRB RPF Notification
- RRB RPF SI Notification
- RRB RPF Constable Notification
- RRB Group D Notification
- RRB RPSF SI Notification
- RRB SSE Notification
- SSC CPO Notification
- SSC MTS Notification
- SSC CGL Notification
- SSC CHSL Notification
- SSC GD Constable Notification
- SSC Stenographer Notification
- SSC JE Notification
- SSC CAPF Notification
- SSC JHT Notification
- Delhi Police Constable Notification
- Delhi Police SI Notification
- KMAT Kerala 2024
- Karnataka TET
- KTET Notification
- UPSC CAPF Notification
- UPSC CDS Notification
- UPSC NDA Notification
- UPSC Civil service Notification
- Question Answer
- Aptitude Questions
- KPSC Degree Level Exam Preparation
- Kerala PSC 12th Level Exam Preparation
- Kerala PSC 10th Level Exam Preparation
- KAS Coaching
- Kerala PSC LDC Coaching
- Kerala PSC LD Typist Coaching
- Kerala PSC Fireman Coaching
- KSFE Assistant Exam Preparation
- Secretariat Office Attendant Coaching
- Secretariat Assistant Coaching
- Kerala PSC SI Exam Coaching
- Khadi Board LDC Exam Preparation
- Devaswom Board LDC Coaching
- University LGS Exam Preparation
- University Assistant Exam Coaching
- KPSC Scientific Officer Exam Coaching
- KPSC Probation Officer Grade II
- KPSC Food Safety Officer Coaching
- KWA Sanitary Chemist Coaching
- KPSC Diary Farm Instructor Exam Coaching
- Kerala PSC KWA Lab Assistant Exam Coaching
- Kerala PSC ICDS Supervisor Exam Coaching
- KPSC Finger Print Searcher Coaching
- KPSC Assistant Dental Surgeon Coaching
- HSA Exam Preparation
- KPSC HSA Social Science Coaching
- KPSC HSA Physical Science Coaching
- KPSC HSA English Coaching
- KPSC Junior Language Teacher Hindi
- KTET Coaching
- SET Coaching
- LP/UP Assistant Exam Coaching
- HSST Exam Preparation
- HSST Commerce Exam Coaching
- Kerala PSC Lecturer in Diet Coaching
- Assistant Engineer Electrical Exam Coaching
- Kerala PSC Industries Extension Officer Coaching
- KPSC LSGD AE Exam Coaching
- KPSC Civil Engineering Exam Coaching
- KPSC Mechanical Engineering Exam Coaching
- KPSC Electrical Engineering Exam Coaching
- KPSC Electronics Engineering Exam Coaching
- KPSC Technical Computer Science Coaching
- KPSC Tradesman Turning Coaching
- Kerala PSC Overseer Exam Coaching
- IELTS Training Online
- SEBI Grade A Coaching
- IBPS SO Online Coaching
- IBPSC PO Online Coaching
- IBPSC Clerk Online Coaching
- SBI PO Coaching
- SBI Clerk Online Coaching
- SBI Apprentice Class
- SBI SO Online Coaching
- RBI Grade B Coaching
- RBI Assistant Coaching
- CSEB Exam Coaching
- IBPS RRB Coaching
- IBPS RRB PO Coaching
- Canara Bank Po Exam Coaching
- Kerala Gramin Bank Coaching
- Kerala Bank Clerk Exam Coaching
- Kerala Bank Office Attendant Exam Coaching
- Kerala Bank Assistant Manager Exam Coaching
- JCI Exam Coaching
- NABARD Grade A Coaching
- LIC AAO Coaching Online
- UPSC CAPF Online Coaching
- SSC JE Online Coaching
- SSC CGL Coaching
- SSC CGL AAO Coaching
- SSC CGL CBI Inspector Coaching
- SSC CHSL Coaching
- SSC MTS Coaching
- SSC Stenographer Coaching
- SSC GD Online Coaching
- RRB RPF Exam Coaching
- RRB NTPC Exam Coaching
- RRB JE Online Coaching
- RRB JE Electronics Coaching
- RRB ALP Exam Coaching
- RRB Technician Exam Coaching
- CAT Online Coaching
- CMAT Online Coaching
- XAT Exam Coaching
- GATE CE Online Coaching
- GATE ME Online Coaching
- GATE EE Online Coaching
- NMAT Exam Coaching
- CSIR NET Exam Coaching
- EMRS Coaching
- CTET Exam Online Coaching
- AAI ATC Jr Executive Coaching

- HTML Tutorial
- DSA Tutorials
- HTML Tutorial for Beginners in Hindi
- Python Tutorial for Beginners in Hindi
- GIT and GITHUB Tutorial for Beginners in Hindi
- JavaScript Tutorial in Tamil
- HTML Tutorial For Beginners in Telugu
- CSS Tutorial for Beginners in Telugu
- Bootstrap Tutorial for Beginner in Telugu
- HTML Tutorial For Beginners in Kannada

MS Power Point – Introduction, Features, Notes PDF
Table of Contents
MS Office PowerPoint is a presentation software application that allows users in the preparation of professional, high-impact, dynamic presentations. The building blocks of a PowerPoint presentation are slides. Slides, help to focus on visuals as well along with the user. In this article, we will be discussing in detail the functions and features of MS PowerPoint.
Looking for a Data science and Machine learning Career? Explore Here!!
MS Power Point – Introduction
Given below are some of the important things that one must know about the development of Microsoft PowerPoint:
- The program was developed by Robert Gaskins and Dennis Austin, in a software company named Forethought, Inc.
- It was released on 20/04/1987, and after 3 months it was acquired by Microsoft.
- The first version when introduced by Microsoft was MS PowerPoint 2.0 which was released in 1990.
- It is a presentation-based application that uses images, videos, graphics, etc. to make a presentation more attractive and interesting.
- The Powerpoint presentation is are saved as “.ppt”files.
- A PowerPoint presentation comprising slides and other attributes is also known as PPT.
Eventually, with every version, the program was more creative and more interactive. Various other features were introduced in PowerPoint which significantly increased the requirement and use of this MS Office program.
MS PowerPoint Practical Application
MS PowerPoint is used in various fields few of them are mentioned below:
- Business: Introduction of products, services, offerings ·
- Sales and Marketing Department: Sales and marketing materials are largely designed on PowerPoint. ·
- Finance Department: To display yearly projections and budgets. ·
- Data Presentation: One can generate create diagrams, derive graphs or charts with massive data. ·
- Stationary Material: One can create certificates, calendars
- Educational Slideshows: They may be used in classrooms for teaching purposes.
- Presentations: It could be used for any family functions like weddings, anniversaries, family reunions, birthdays, etc.
Features of MS PowerPoint
Some of the features are discussed below:
PowerPoint Design Ideas
- It can be found in the “ Design ” tab in the PowerPoint Ribbon.
- You can choose the desired design for your PPT.
- MS PowerPoint animations helps you to emphasize certain points of your present
- Entrance Animation
- Emphasis Animation
- Exit Animations
- Each animation category gives you a list of additional options to choose from.
Slide Transitions
- While animation allows you to animate elements within your slide, transitions allows you to change how slides change from one to another.
- This can have a remarkable impact on a slide’s first impressions.
- Some of the most important transitions are:
- There are two main ways of adding images.
- You could either add an image from your Personal Computer or you can embed an image from the internet.
Merge Shapes
- MS PPT allows you to merge shapes. This is because you might not always have the exact shape that you are looking for.
- Videos can be easily added from the storage on your Personal Computer.
- Videos can also be selected from the internet.
- With the feature to add icons into your presentations, it just gives you some freedom to add a personal touch to the presentation.
PowerPoint Notes for Presentation
- Note features help you remember what to say for each slide which is a great way to stay on topic.
- Your presentation can be made in such a way that the notes do not appear on the slides but they still appear on your PC or Mac.
Morph Transition
- By using Morph Transition, you can make elements move between slides giving a video like feel to your PPT!
- Charts are used in presentations to illustrate data in an easy-to-understand way for your audience.
- Charts can be linked to external data sources or even excel sheets.
- The charts also easily getup dated automatically in PPT when the data is edited in excel.
Removing Background from Images
- With Microsoft PowerPoint, you can remove a background from your image
Video Editing (Basic)
- It allows you to trim, cut portions of a video out, and even add
- It works as a basic video editor.
Export PowerPoint as Video
- The entire presentation can be exported as videos in Microsoft PowerPoint.
Add Audio Narration
- MS PowerPoint allows you to add audio narration to your presentation.
Adding Comments to Slides
- Comment feature is more relevant to the person who reviews a presentation rather than the person who creates it.
Click on the link for complete notes on MS PowerPoint : MS PowerPoint PDF Download .

Famida is an experienced educator with over a decade of teaching experience, specializing in grades 8 to 12, business management (BBM), and electronics engineering. Holding a Master's degree in Electronics and Communication Engineering, she has also trained interns in IoT. For the past four years, Famida has been writing articles for Entri, focusing on exam preparation tips, question papers, and study plans. She also creates practice questions for the Entri app and provides support to users. Additionally, Famida's writing skills extend to parenting and personal blogs, as well as curriculum development.
Related Posts

- BIM | Building Information Modelling

- MOH Exam Registration: Step-by-Step Guide

- Describe a Famous Person That You Are Interested In

UPSC NDA Selection Process 2022

Latest Posts
- Rebooting Instagram Recommendation: A Guide to the New Feature
- Describe a Story or Novel That Was Interesting to You
Trending Posts

List of 28 States of India and their Capitals and Languages 2024 – PDF Download
List of government banks in india 2024: all you need to know, tnpsc group 2 posts and salary details 2022, new map of india with states and capitals 2024, gandhi jayanti quiz 2024 malayalam – pdf, attempt for free, online.

- Data Science Course
- Full Stack Developer Course
- Data Science Course in Malayalam
- Full Stack Developer Course in Malayalam
- Full Stack Developer Course in Hindi
- Full Stack Developer Course in Tamil
- Full Stack Developer Course in Telugu
- Full Stack Developer Course in Kannada
- Practical Accounting Course
- Stock Market Course
- SAP FICO Training
- SAP MM Training
- ACCA Online Course
- Become a teacher
- Login to Entri Web
Spoken English Courses
- Spoken English Course
- Spoken English Course for Housewives
- Spoken English Course for Working Professionals
- Spoken English Course for School Students
- Spoken English Course for College Students
- Spoken English Course for Job Seekers
- AI Powered Spoken English Course
Quick Links
- Entri Daily Quiz Practice
- Current Affairs & GK
- News Capsule – eBook
- Preparation Tips
- Kerala PSC Gold
- Entri Skilling
Other Courses
- OET Coaching Classes
- Nurse Recruitment Abroad
- Montessori Teachers Training
- Digital Marketing Course
- German Language A1 Course
- German Language A2 Course
- German Language B1 Course
- German Language B2 Course
- Business Administration & Hospital Management
Popular Exam
- Railway RRB Exam
- Tamil Nadu PSC
- Telangana PSC
- Andhra Pradesh PSC
- Staff Selection Commission Exam
© 2023 Entri.app - Privacy Policy | Terms of Service
- OET Coaching
- Kerala Bank Exam Coaching
- Trending Now
- Foundational Courses
- Data Science
- Practice Problem
- Machine Learning
- System Design
- DevOps Tutorial
Introduction to Computer Graphics
The term ‘Computer Graphics’ was coined by Verne Hudson and William Fetter from Boeing who were pioneers in the field. Computer graphics is a dynamic and essential field within computing that involves the creation, manipulation, and rendering of visual content using computers.
In today’s digital era, computer graphics technologies have revolutionized how we perceive and interact with visual information, playing a pivotal role in video games, movies, architectural design, medical imaging, and more. There are several tools used for the implementation of Computer Graphics. The basic is the graphics.h header file in Turbo-C, Unity for advanced, and even OpenGL can be used for its Implementation.
This article delves into the fundamental concepts of computer graphics, its diverse applications, and the underlying technologies that drive innovation in this field.
What is Computer Graphics?
Computer Graphics including digital images, animations, and interactive graphics used in various sectors such as entertainment, education, scientific visualization, and virtual reality. Computer Graphics can be used in UI design , rendering, geometric objects, animation, and many more. In most areas, computer graphics is an abbreviation of CG.
Computer Graphics refers to several things
- The manipulation and the representation of the image or the data in a graphical manner.
- Various technology is required for the creation and manipulation.
- Digital synthesis and its manipulation.
Computer graphics is a wide-ranging topic that covers rendering, modeling, and visualization techniques . For students preparing for GATE, the GATE CS Self-Paced Course provides comprehensive lessons on both theoretical and practical aspects of computer graphics, helping you build a strong foundation.
Types of Computer Graphics
- Raster Graphics: In raster, graphics pixels are used for an image to be drawn. It is also known as a bitmap image in which a sequence of images is into smaller pixels. Basically, a bitmap indicates a large number of pixels together.
- Vector Graphics: In vector graphics , mathematical formulae are used to draw different types of shapes, lines, objects, and so on.
Applications of Computer Graphics
There are many applications of computer graphics discussed below-
- Computer Graphics are used for the aided design of systems engineering and architectural systems- These are used in electrical automobiles and electro-mechanical, and electronic devices. For example gears and bolts.
- Computer Art – MS Paint.
- Presentation Graphics – It is used to summarize financial statistical scientific or economic data. For example- Bar charts systems and line charts.
- Entertainment- It is used in motion pictures, music videos, and television gaming.
- Education and training- It is used to understand the operations of complex systems. It is also used for specialized systems such as framing for captains, pilots, and so on.
- Visualization- To study trends and patterns. For example- Analyzing satellite photos of earth.
Why are Computer Graphics used?
Imagine a car manufacturing company that wants to showcase its vehicle sales over the past decade. Storing and presenting this huge amount of data can be both time-consuming and memory-intensive. Furthermore, it can be difficult for the average person to understand. In such cases, by using graphics can be a more effective solution. By using charts and graphs to visually signify the data, it becomes much easier to understand and analyse the data.
Interactive computer graphics utilize a two-way communication concept between users and computers. The computer receives input signals from the user, and the picture is modified accordingly. When a command is applied, the picture updates promptly.
How To Get Started in Computer Graphics
Step by step process to getting started with computer graphics-
Step-1: Understaind the basics
Learn the fundamental and basics of computer graphics such as rendering, shading, animation, and modeling. Learn basic concepts of mathematics like linear algebra , geometry , and calculus as well as basic principles of physics that support computer graphics.

Step-2: Choose Your Area of Interest
Choose your area of interest like 2D-Graphics, 3D-Graphics, Animation, and special effect (VFX ).
Step-3: Learn Programming
Learn programming language that is used in graphics, such as Python , C++ , and JavaScript . Learn about Graphics Libraries and APIs like OpenGL , Vulkan, DirectX, and frameworks like WebGL that is used in web based graphics.
Step-4: Use Graphics Software
Learn about modeling and animation tools such as Blender , Autodesk Maya , or 3ds Max for 3D modeling and animation. Learn about 2D-Graphics software like Adobe Photoshop, Illustrator, and GIMP.
Step-5: Study and Practice
Take online courses and tutorials, many institution offer Computer Graphics course like Coursera, Udemy, and Khan Academy. And read textbooks like “Computer Graphics: Principles and Practice” by John F. Hughes. Now, Starts with simple projects, such as creating basic shapes and gradually move on to more complex scenes and animations.
Step-6: Create a portfolio of your work
create your own projects and build an online portfolio to display your work, which is helpful for job application.
Step-7: Apply for jobs in computer graphics
If you aim to build a career in computer graphics and grow in this field, gaining experience is important. Search for entry-level positions, freelance, contract work, and internships. When searching for jobs, read the descriptions carefully to understand the responsibilities, required qualifications, and company details. This will help you find roles that align with your career goals and skill set.
Frequently Asked Question On Computer Graphics – FAQs
What are examples of computer graphics.
Examples of computer graphics are photographs, drawings, line art, mathematical graphs, line graphs, charts, diagrams, typography, numbers, symbols, geometric designs, maps, engineering drawings, or other images. Graphics often combine text, illustration, and color.
What are the different types of computer graphics?
There are two type of computer graphics Vector graphics Raster graphics
What are the basic elements of computer graphics?
Basic elements of computer graphics included Line, Shape, Form, Texture, Space, Imagery, Typography, Color.
What are the main application of computer graphics?
main application of computer graphics are in marketing, entertainment, education, healthcare, architecture.
What are the four type of computer graphics?
Four type of computer graphics are Raster graphics Vector graphics 3D-Graphics Animation
Similar Reads
- Computer Subject
- computer-graphics
Improve your Coding Skills with Practice
What kind of Experience do you want to share?

Presentation Training Institute
A division of bold new directions training, the use of graphics and images in presentations.
Visual tools and techniques are a great way to create interest and enhance the effectiveness of a presentation. When used strategically, graphics and images can help engage the audience, clarify concepts, emphasize key points, and create a more memorable presentation. Here we will discuss some of the ways graphics and images can be used effectively in a presentation.
Why Use Graphics in Your Presentations
Graphics and images are a great way to capture the attention of your audience and make your presentation more visually appealing. Rather than bombard your audience with text heavy slides, graphics and images are more visually stimulating and will grab the attention of the audience, keeping them engaged. Furthermore, graphics and images can be useful for communicating complex ideas and information in a clear and digestible manner. Visual representations such as charts, graphs, tables, and diagrams can help simplify and illustrate complex information so that it is easier for the audience to understand. Visual aids are also a great way to highlight important points and reinforce your message. Finally, visual aids can evoke emotion and create a sense of connection with your audience. Compelling images that resonate with your audience will help them connect with your message on a deeper level.
Tips for Using Graphics and Images Effectively
1. choose relevant and high-quality images.
It is important to choose high-quality images and graphics that are relevant to your message and support your content. Avoid low-resolution images that are blurry or distorted, as this will distract your audience and detract from your message.
2. Balance Text and Visuals
While visuals can be a great way to communicate your message, don’t overload your slides with too many images. Images and graphics are meant to support and complement your text, not replace it altogether. Use graphics and images to show, not tell, your audience what you mean. A good rule of thumb is a 60:40 ratio of text/images in your presentation.
3. Avoid Generic Images
Images and graphics should be used sparingly, so choose authentic and meaningful images that will resonate with your audience. Avoid generic or cliche images, as these will not add value to your presentation.
In conclusion, the use of graphics and images can be a powerful tool in presentations as a means for connecting with your audience and explaining complex concepts. When used effectively, images and graphics can create a more meaningful and memorable experience for the audience.
Critical PowerPoint Shortcuts – Claim Your FREE Training Module and Get Your Time Back!

PowerPoint Graphics: How to Improve Your Presentations w/ Graphics
- PowerPoint Tutorials
- Pictures, Icons, Videos, Etc.
- Presentation Design
- August 21, 2018
If you’ve ever touched a PowerPoint slide, chances are that you’ve already used PowerPoint graphics already.
But you may have questions: How do you find good graphics? How do you manipulate them correctly? And how do you customize them?
That’s what this article will answer for you.
What is a PowerPoint graphic?
There seems to be a wide range of things that people label as a graphic for PowerPoint.
Here at Nuts & Bolts, we define a graphic in PowerPoint as any image that is not a picture. This includes SmartArt, which is a type of native PowerPoint graphic and has special attributes.
A PowerPoint graphic most typically refers to a grouping of shapes into an image, commonly referred to as vectors.
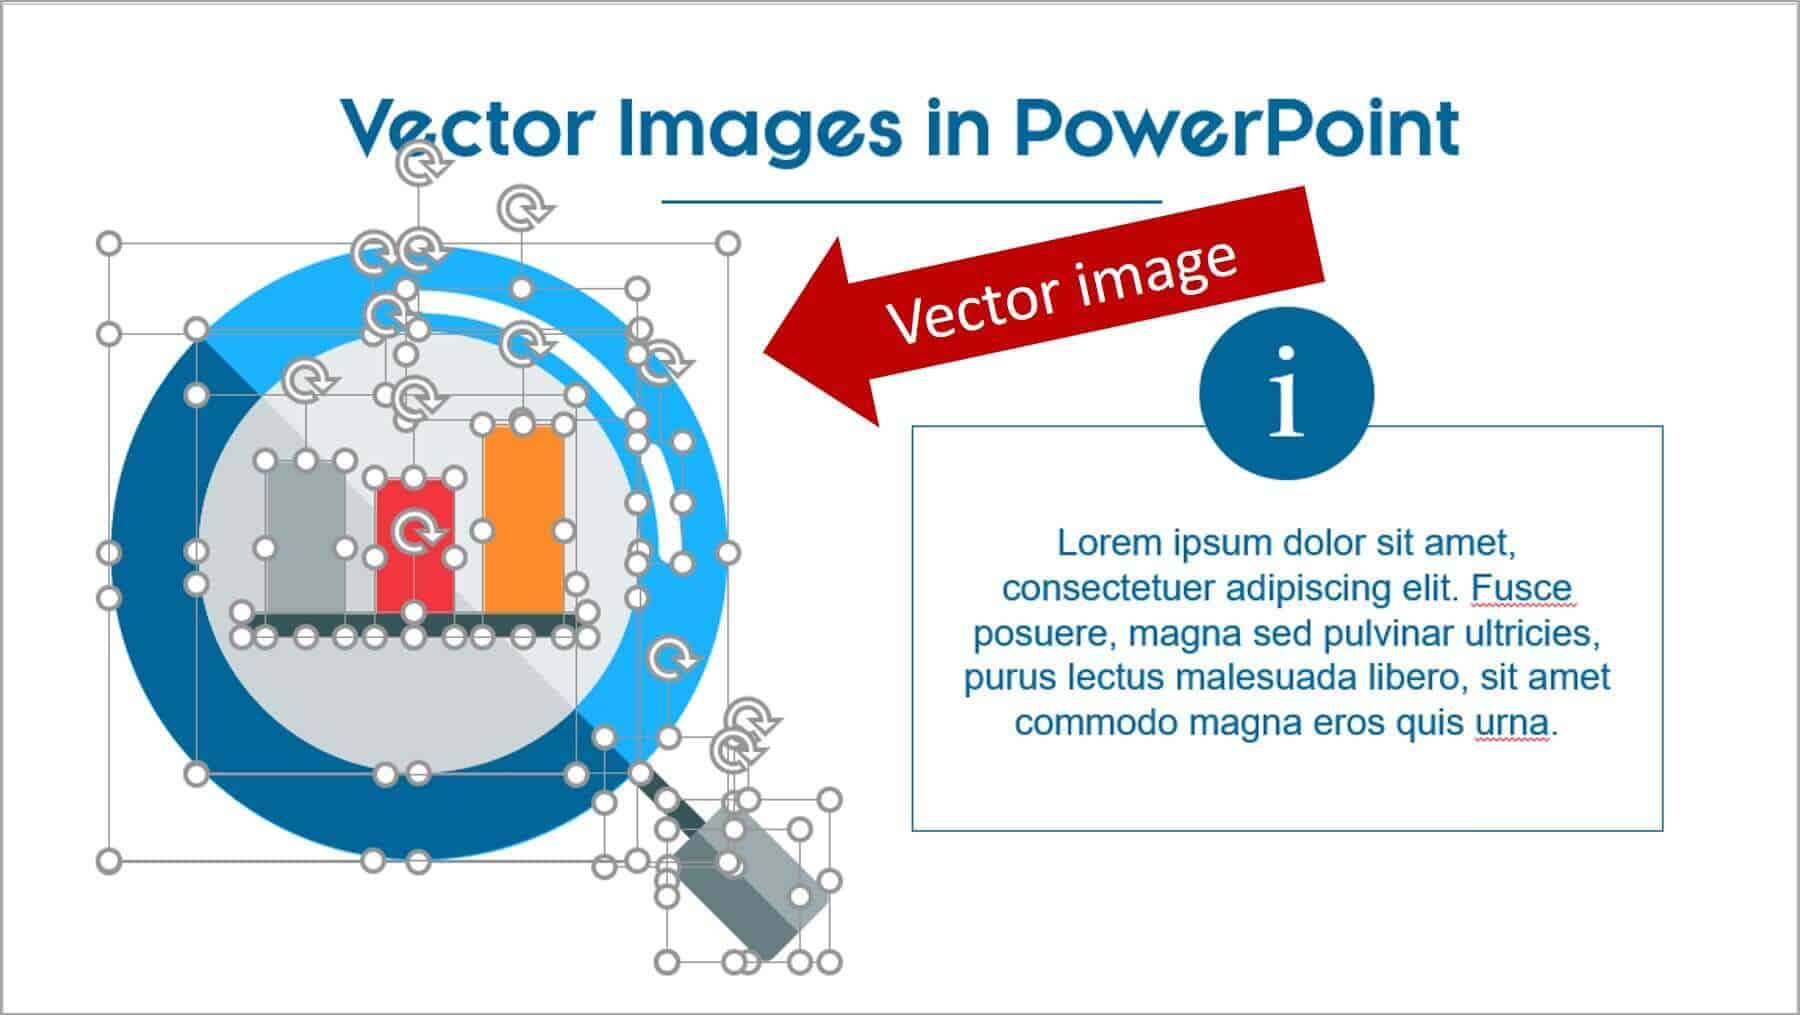
From PowerPoint’s perspective, vectors are considered to be shapes – and that means that you can customize them as you would any rectangle, circle, or freeform shape… giving you complete freedom to create the visual you need.
Vector graphics can come in the following file types:
- EPS (Encapsulated PostScript – create by Adobe – this is perhaps the most common vector image format)
However, PowerPoint will only accept certain file types. To see which ones, go to the section on how to use vectors in PowerPoint below.
Why use a graphic in PowerPoint
As the representation of an idea, a graphic is the perfect way to help your audience immediately visualize and grasp a concept you are sharing with them.
On top of that, it’s a great way to add some flair to any presentation and a quick way to take it up a notch.
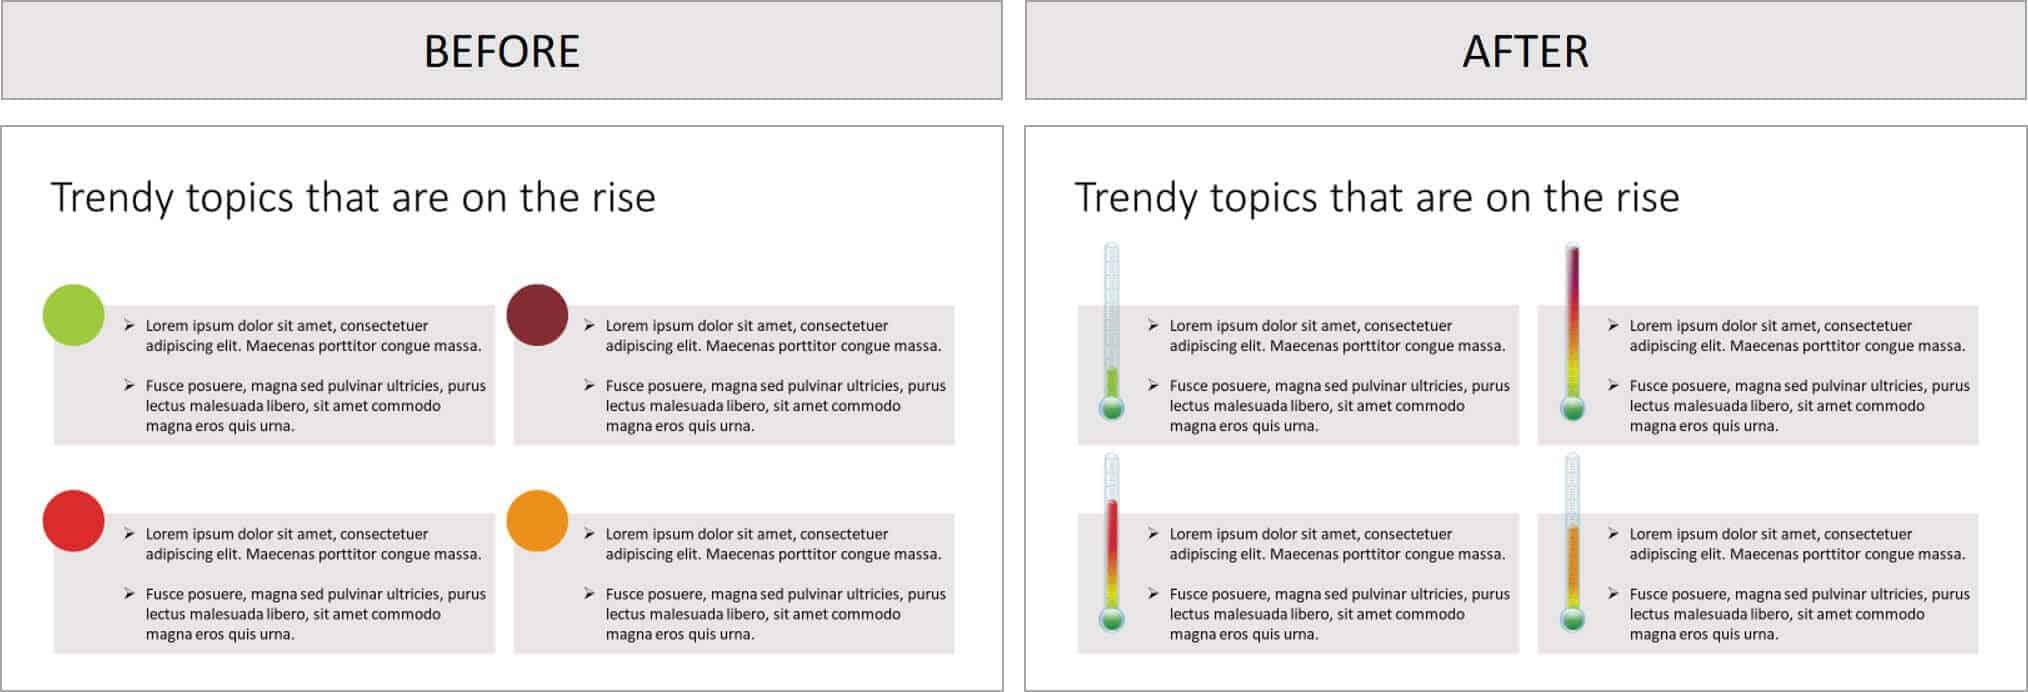
Graphics can be better than pictures in some situations, when you need to be able to edit elements in a visual. For example, maybe you need to remove, add or re-color a certain item.

You cannot do this with pictures – but with the right graphic (and in particular a vector graphic), you could potentially customize it to your heart’s content.
Where to get free graphics for PowerPoint
Getting free graphics for PowerPoint is easy – you just have to know where to look.
Here are our favorite 2 places to find free vector graphics for PowerPoint:
- Freepik – Great database with tons of very high-quality and modern icons, flat icons, vectors, and PSD files to use. Freepik does require you to give them credit if you use their material, but they make it very easy with a simple html code.
- Pixabay – Awesome site for 100% free and Creative Commons CC0 licensed images, illustrations, vectors, and videos.
To learn where to get more free PowerPoint graphics, images, videos, etc. check out this list of our favorite PowerPoint resources . Another way to get free vector graphics is to create them from scratch. There are two tools that can help you do this:
- Text-to-Outline by YouPresent – Allows you to convert text into vectors/shapes, which you can then format any way you like in PowerPoint.
- Vector Magic – Creates a vector out of any image…truly magic!
Keep in mind that because these are all free methods for finding vector graphics for PowerPoint, you will be limited in what you find or create. If you want a very specific and professional-looking vector, you may have to go to a paid service to purchase well-designed graphics that suit your need better.
Where to buy graphics for PowerPoint
By far the easiest way to get professional & unique graphics onto your slides (especially now that ClipArt is gone) is to use a service like GetMyGraphics .
They are custom-built graphics designed for PowerPoint. All you need to do is download and insert them onto your slide and then tweak them like you would SmartArt.
Although this is a paid service, we’ve found that we’ve reused these graphics again and again, so we see it as a good investment in sharper looking slides.
How to use vector graphics in PowerPoint
Using vectors in PowerPoint depends on what file type you have. If you have an older version of PowerPoint (2013 and earlier), you can insert the following vector files types into PowerPoint:
If you have Office 365, you can no longer insert EPS files. However, you can still use EMF files, and you can also insert SVG files (except for on a Mac).
If you have an EPS file and can’t import it into your version of PowerPoint, check out our article on how to import EPS files into PowerPoint .
Note: If you’re trying to use a file type that is not supported by your version of PowerPoint, you can try converting your file into the correct file type.
For a really good tutorial on how to convert vectors into usable PowerPoint objects without Adobe software, check out Microsoft MVP Dave Paradi’s post on finding and using vector images in PowerPoint.
Once you have an SVG file downloaded onto your computer, you’ll want to insert it into your presentation.
There are two ways to insert a vector file onto your PowerPoint slide:
Method #1: Drag the file from wherever it is sitting on your computer and drag it onto your slide.
Method #2: Go to the Insert tab in the Ribbon and select ‘Pictures’ (make sure to select the ‘Pictures’ icon and not the ‘Online Pictures’ icon). Then find your vector file and click on ‘Open.’
Note: If you have PowerPoint 2016 with Office 365, you have a new object class, called Icons. These are also vector files (SVG).
You can insert them by going to the Insert tab in the Ribbon and selecting ‘Icons’ (or using this shortcut: Alt, N, Y1). You can learn more about the icons feature in this Office blog article .
Once you have a vector file inserted on your slide, you can manipulate its various pieces.
To do that, you’ll need to ungroup it twice. To ungroup a vector image, select it and then use one of the following methods:
- Hit the ungroup shortcut: Ctrl + Shift + G
- Right-click the vector and select ‘Group’ and then ‘Ungroup’
- Go to the Drawing Tools > Format tab in the Ribbon, select ‘Group’ and then ‘Ungroup’
A pop-up box will appear, asking you if you want to ungroup it. Click on ‘Yes.’

And now you have a series of shapes (instead of a picture) that you can edit and format however you like, just like for regular PowerPoint shapes.
Note: Keep in mind that some things might come out strangely as vectors in PowerPoint:
- Gradients and shadows
- Lines (the lines will likely come out as one object and may lose their original weight)
- Complex artwork, such as sketching and other artistic effects
Some things you can do with your vector images now include:
- Change the fill color
- Add an outline with a custom weight
- Move and resize pieces of the vector
- Edit the points of certain pieces to change even the shape of it
And much more!
What’s next?
Related articles, about the author.
Popular Tutorials
- How to Strikethrough Text (l̶i̶k̶e̶ ̶t̶h̶i̶s̶) in Word, Excel & PowerPoint
- How to Make Animated Fireworks in PowerPoint (Step-by-Step)
- Strikethrough Shortcut (l̶i̶k̶e̶ ̶t̶h̶i̶s̶) for Word, Excel & PowerPoint
- How to Create a Flash Card Memory Game in PowerPoint (Like Jeopardy)
- Keyboard Shortcuts Not Working: Solved
PowerPoint Tutorial Categories
- Strategies & Opinions
- Shortcuts & Hacks
- New Features
- Miscellaneous
- Charts & Data Viz
We help busy professionals save hours and gain peace of mind, with corporate workshops, self-paced courses and tutorials for PowerPoint and Word.
Work With Us
- Corporate Training
- Presentation & Template Design
- Courses & Downloads
- PowerPoint Articles
- Word Articles
- Productivity Resources
Find a Tutorial
- Free Training
- For Businesses
We help busy office workers save hours and gain peace of mind, with tips, training and tutorials for Microsoft PowerPoint and Word.
Master Critical PowerPoint Shortcuts – Secure Your FREE Training Module and Save Valuable Time!
⌛ Master time-saving expert techniques.
🔥 Create powerful presentations.
🚀 Propel your career to new heights.
We value your privacy – we keep your info safe.
Discover PowerPoint Hacks Loved by Industry Giants - KKR, AmEx, HSBC!
Over 114,880 professionals in finance, marketing and sales have revolutionized their PPT skills with our proven methods.
Gain FREE access to a full module of our premium PowerPoint training program – Get started today!
We hate spam too and promise to keep your information safe.
You are currently viewing a placeholder content from Facebook . To access the actual content, click the button below. Please note that doing so will share data with third-party providers.

IMAGES
VIDEO
COMMENTS
Presentation graphics provides predefined backgrounds and simple page layouts to help in the creation of slides. These slides can be moved automatically within seconds. Slides: Slides mean we have text, graphics, audio clips, video clips, animations, and other effects Presentation graphics is also known as Presentation Software. The best ...
This is the first of a series of blog posts that will give you tips and tricks on how to perfect your visual presentations. Your job as a presenter is to build your idea -- step-by-step -- in the minds of your audience members. One tool to do that is presentation graphics, such as slides and videos. Why graphics for your presentation?
MS Office PowerPoint is a presentation software application that allows users in the preparation of professional, high-impact, dynamic presentations. The ... graphics, etc. to make a presentation more attractive and interesting. The Powerpoint presentation is are saved as ".ppt"files. ... PowerPoint Notes for Presentation.
Computer Graphics are used for the aided design of systems engineering and architectural systems- These are used in electrical automobiles and electro-mechanical, and electronic devices. For example gears and bolts. Computer Art - MS Paint. Presentation Graphics - It is used to summarize financial statistical scientific or economic data. For example- Bar charts systems and line charts.
This software allows you to design presentations by combining text, images, graphics, video, and animation on slides in a simple and intuitive way. ... In short, this is the main page of PowerPoint, where you can create a new presentation or open an older one. ... Add speaker notes to your presentation. Step 7: Slideshow your presentation.
Why Use Graphics in Your Presentations. Graphics and images are a great way to capture the attention of your audience and make your presentation more visually appealing. Rather than bombard your audience with text heavy slides, graphics and images are more visually stimulating and will grab the attention of the audience, keeping them engaged.
A visual presentation is a communication method that utilizes visual elements such as images, graphics, charts, slides and other visual aids to convey information, ideas or messages to an audience. Visual presentations aim to enhance comprehension engagement and the overall impact of the message through the strategic use of visuals.
Presentation software, also known as graphics presentation applications or presentation graphics programs, is a category of software used to create content where information is often represented in a graphical or visual way. ... Once content is added to the software, the designer converts notes, data and more into visually rich slides. The ...
Graphic elements are used in the text, document, and PDF presentation. Static images are used in mobile applications and websites. Business graphics are used as brochures, business cards, menu of the hotel. Representation of graphics We can represent the graphics by following two ways: 1. Raster (Bitmap) Graphics 2. Vector Graphics 1.
Note: If you're trying to use a file type that is not supported by your version of PowerPoint, you can try converting your file into the correct file type. For a really good tutorial on how to convert vectors into usable PowerPoint objects without Adobe software, check out Microsoft MVP Dave Paradi's post on finding and using vector images ...