- High School
- You don't have any recent items yet.
- You don't have any courses yet.
- You don't have any books yet.
- You don't have any Studylists yet.
- Information

Lab Report 5 - Experiment 6: The Photoelectric Effect
Classical physics (ph102), the university of the south pacific.
Students also viewed
- PH102 Exam (2018 ) - test papers
- PH102 Exam (2016 ) - test papers
- PH102 Exam (2019 ) - test papers
- PH102 Exam (2022) - test papers
- PH102 Final Exam (2023)
- PH102 Exam (2017 ) - test papers
Related documents
- PH102 short test 2 - 2019
- Test 1 Solutions 2022 - test papers
- PH 102 lab 4 final - Lab
- Determination OF THE Ratio OF THE Specific Heats OF AIR
- Lab Report 4 - Experiment 12: The Series Resonant Circuit
- Lab write up 4 ph 102
Related Studylists
Preview text, ph103 – quantum & electrical physics, experiment 6: the photoelectric effect.
This experiment aims for the following [ CITATION Kum13 \l 3081 ];
To examine some aspects of the photoelectric effect. also, to determine the Planck’s constant value denoted as ‘h’.
The following list below are the electronic components required to conduct the experiment [CITATION Kum13 \l 3081 ];
IEC Photoelectric Unit which comprises a photo emissive cell,
a high gain transistor amplifier,, a calibrated voltage divider,, a dry battery of 9v,, the cro unit and the color filters, and a tungsten filament lamp of 40w..
IEC Photoelectric Unit
Results Data Analysis:
There are three parts carried out in this experiment. The first part is called the Photo-electric Effect which it explains the effect of photo electric for the backing voltage and the tube current. The second part is called Planck’s Constant, h where it explains the purpose of backing voltage increasing until the tube current gives zero and it also will tabulate the data table provided in the manual together with graphs, calculation and comparison. And the third and last part is called relationship between Illumination and Current where it shows a data table together with a graph and observational reasons regarding the phototube current.
Part A: Photo Electric Effect
The photoelectric effect for the backing voltage was recorded as 0Volts whereas the tube current observed to be oμA. The reading of the tube current happens or occur the moment the light is connected to the rails of the tube. Hence, 0μA is the amount of current that has been passed due to the electrons being omitted from the metal surface in the photoelectric unit
Part B: Planck’s Constant (h)
What is the purpose of doing this? Step 3
The following table presented the measured and calculated data of all values needed for this particular part and will also be used to sketch the graph of backing voltage against frequency, obtaining the Planck constant and its percentage error. Also, below (above the table) is the sample calculation of the frequency and the average backing voltage in which filter color orange is used. Note that the speed of light, c is 3 × 10⁸ m / s whereas λ is wavelength which is given in the table below.
Sample calculation of Frequency & Backing Voltage:
Frequency (Orange), f = cλ = 3 × 10
8 530 × 10 − 9 =5 × 10
Average backing voltage (Orange),
V =| T 1 + T 32 + T 3 |=|(−0)+(−0 3 )+(−0)|=0.
-2 -1 0 1 2 3 4 5 6 7 8
f(x) = 0 x − 1.
Backing Voltage Vs Frequency
Frequency ((×10^14 ) 𝐀𝐀
Backing Voltage (V)
0 5 5 6 6 7 7.
According to the theory behind photoelectric effect, we know that the electro-voltage, eV is equal to the product of planck’s constant, h and frequency, f subtracting the work function,
φ. And when the electro-voltage, eV equation compares to the quadratic equation, there are some comparisons which can be determined and one is that the slope of the graph of backing voltage versus frequency is equals to the product of planck’s constant and frequency in electro-volts. Another comparison is that the work function, is equals to the y-interceptɸ of the graph. The equation of the trend line of the graph above is approximately equals to
0 – 1. All the details expressions are shown below. Note that f = cλ .
eV = hf − φ≅y = mx + c
V = hceλ − φe = hce 1 λ − φe,so the slope , m = hce →h = m ×ec ∧ y −∫. = φe
¿ the graphabove ,the trend lineequationis y =0 x −1.
thereforem =0∧ y −∫. =1.
So, the planck’s constant determine from the graph above is 1 × 10 − 28 J ∨1917866 × 10 − 34 J whereas the accepted planck’s constant value is 6 × 10 − 34 J . And that makes a difference of around 1 × 10 − 26 %=0 ... 001918 % ≈ 0 %. Hence, in comparison of the two planck’s constant value, there are not much difference which shows a bit of accuracy while measuring the trials of backing voltage. Thus, the percentage error of planck’s constant is approximately 0%.
Part C: Relationship between Illumination and Current
The data table given below records the dimension of apertures of different size which will also be used to determine the area of each aperture size and also the phototube current. Note that the area of the aperture is determined using the given diameter.
Diameter (m) Area ( × 10 − 3 m 2 ) Phototube Current (μA) 0 0 0. 0 0 0. 0 0 0. 0 1 0.
All characteristics of light described by quantum theory and according to the experimental analysis above, the data shows the release of light energy from the energy source packs of the frequency specifically due to the emission of electrons from the metal surface. And in comparison, to Einstein’s theory which states that light travels in a group of energy where each energy group called photon and all individual photons has the same amount of energy quantity as the product of frequency and planck’s constant. The graph of backing voltage against the frequency showcases a clear image of quantum nature theory of light.
The backing voltage depends on the light frequency due to the relationship expressed in the formula of electric-voltage eV = hf − φ where hf is the energy source and work function ɸ is minimum energy of metal. A clear image displaying the relationship is shown in the graph of backing voltage against frequency above. However, there is no relationship between the backing voltage and intensity but the frequency of light does have a relationship with intensity. Hence, light frequency is directly proportional to both backing volts and intensity.
The photoelectric effect can be observed in other metal surfaces with the equivalent incident light condition depending on the type of the metal. However, it is not necessary because all metals have its’ own work function in which the minimum energy needed to free electrons from its surface. For instance, metals with a low work function such as potassium can display photoelectric the moment it is illuminated by lower energy photons. On the other hand, metals with higher work function needs more active photons.
Conclusion:
To conclude, the experiment was successfully completed where all the required tables, graphs and calculations were all displayed above. The photoelectric effect was able to be observed from the first part of the experiment due to the backing voltage of 0V and tube current of 0μA. In the second part, the planck’s constant of 1 × 10 − 28 J was able to determine from the graph of stopping or backing voltage versus frequency and in comparison, with the accepted value of the backing voltage of 6 × 10 − 34 J , the percentage error is approximately 0%. And in the third part, the relationship of the current and illumination was able to be observed from the graph of phototube current versus aperture area. Thus, there are certain experimental errors occur during the process of the
experiment, these errors happen due to old electrical components and the lack of accuracy in data readings.
References:
Kumar, D. S. et al., 2009. PH103: Quantum & Electrical Physics, Suva: Physics Department.
- Multiple Choice
Course : classical physics (ph102)
University : the university of the south pacific.

- Discover more from: classical physics ph102 The University of the South Pacific 86 Documents Go to course
- More from: classical physics ph102 The University of the South Pacific 86 Documents Go to course
- More from: Studocu by Sean Bourne 13 13 documents Go to Studylist
- Lecture Demonstration Manual
- Lab Manuals
- Instructional Videos
- PhotoSpheres
You are here
Table of contents.
- Experiment 1 - Magnetic Fields of Coils and Faraday's Law
- Experiment 2 - Microwave Optics
- Experiment 3 - Geometrical Optics
- Experiment 4 - Physical Optics
- Experiment 5 - Fluids and Thermodynamics
Experiment 6 - The Photoelectric Effect
- Experiment 7 - Radioactivity
- Photodiode with amplifier
- Batteries to operate amplifier and provide reverse voltage
- Digital voltmeter to read reverse voltage
- Source of monochromatic light beams to irradiate photocathode
- Neutral filter to vary light intensity
INTRODUCTION
The energy quantization of electromagnetic radiation in general, and of light in particular, is expressed in the famous relation
\begin{eqnarray} E &=& hf, \label{eqn_1} \end{eqnarray}
where \(E\) is the energy of the radiation, \(f\) is its frequency, and \(h\) is Planck's constant (6.63×10 -34 Js). The notion of light quantization was first introduced by Planck. Its validity is based on solid experimental evidence, most notably the photoelectric effect . The basic physical process underlying this effect is the emission of electrons in metals exposed to light. There are four aspects of photoelectron emission which conflict with the classical view that the instantaneous intensity of electromagnetic radiation is given by the Poynting vector \(\textbf{S}\):
\begin{eqnarray} \textbf{S} &=& (\textbf{E}\times\textbf{B})/\mu_0, \label{eqn_2} \end{eqnarray}
with \(\textbf{E}\) and \(\textbf{B}\) the electric and magnetic fields of the radiation, respectively, and μ 0 (4π×10 -7 Tm/A) the permeability of free space. Specifically:
No photoelectrons are emitted from the metal when the incident light is below a minimum frequency, regardless of its intensity. (The value of the minimum frequency is unique to each metal.)
Photoelectrons are emitted from the metal when the incident light is above a threshold frequency. The kinetic energy of the emitted photoelectrons increases with the frequency of the light.
The number of emitted photoelectrons increases with the intensity of the incident light. However, the kinetic energy of these electrons is independent of the light intensity.
Photoemission is effectively instantaneous.
Consider the conduction electrons in a metal to be bound in a well-defined potential. The energy required to release an electron is called the work function \(W_0\) of the metal. In the classical model, a photoelectron could be released if the incident light had sufficient intensity. However, Eq. \eqref{eqn_1} requires that the light exceed a threshold frequency \(f_{\textrm{t}}\) for an electron to be emitted. If \(f > f_{\textrm{t}}\), then a single light quantum (called a photon ) of energy \(E = hf\) is sufficient to liberate an electron, and any residual energy carried by the photon is converted into the kinetic energy of the electron. Thus, from energy conservation, \(E = W_0 + K\), or
\begin{eqnarray} K &=& (1/2)mv^2 = E - W_0 = hf - W_0. \label{eqn_3} \end{eqnarray}
When the incident light intensity is increased, more photons are available for the release of electrons, and the magnitude of the photoelectric current increases. From Eq. \eqref{eqn_3}, we see that the kinetic energy of the electrons is independent of the light intensity and depends only on the frequency.
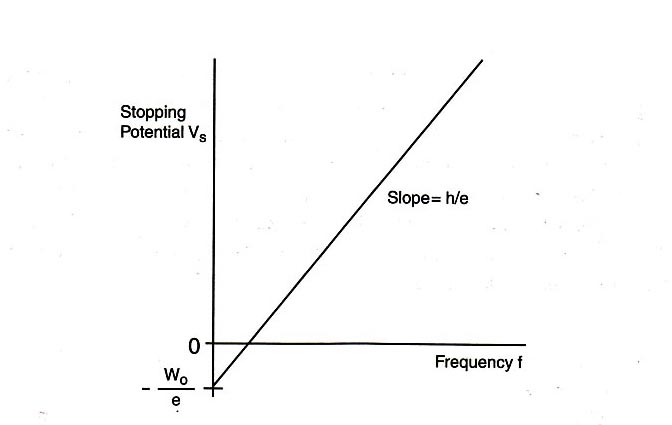
The photoelectric current in a typical setup is extremely small, and making a precise measurement is difficult. Normally the electrons will reach the anode of the photodiode, and their number can be measured from the (minute) anode current. However, we can apply a reverse voltage to the anode; this reverse voltage repels the electrons and prevents them from reaching the anode. The minimum required voltage is called the stopping potential \(V_{\textrm{s}}\), and the “stopping energy” of each electron is therefore \(eV_{\textrm{s}}\). Thus,
\begin{eqnarray} eV_{\textrm{s}} &=& hf - W_0, \label{eqn_4} \end{eqnarray}
\begin{eqnarray} V_{\textrm{s}} &=& (h/e)f - W_0/e. \label{eqn_5} \end{eqnarray}
Eq. \eqref{eqn_5} shows a linear relationship between the stopping potential \(V_{\textrm{s}}\) and the light frequency \(f\), with slope \(h/e\) and vertical intercept \(-W_0/e\). If the value of the electron charge \(e\) is known, then this equation provides a good method for determining Planck's constant \(h\). In this experiment, we will measure the stopping potential with modern electronics.
THE PHOTODIODE AND ITS READOUT
The central element of the apparatus is the photodiode tube. The diode has a window which allows light to enter, and the cathode is a clean metal surface. To prevent the collision of electrons with air molecules, the diode tube is evacuated.
The photodiode and its associated electronics have a small “capacitance” and develop a voltage as they become charged by the emitted electrons. When the voltage across this “capacitor” reaches the stopping potential of the cathode, the voltage difference between the cathode and anode (which is equal to the stopping potential) stabilizes.
To measure the stopping potential, we use a very sensitive amplifier which has an input impedance larger than 10 13 ohms. The amplifier enables us to investigate the minuscule number of photoelectrons that are produced.
It would take considerable time to discharge the anode at the completion of a measurement by the usual high-leakage resistance of the circuit components, as the input impedance of the amplifier is very high. To speed up this process, a shorting switch is provided; it is labeled “Push to Zero”. The amplifier output will not stay at 0 volts very long after the switch is released. However, the anode output does stabilize once the photoelectrons charge it up.
There are two 9-volt batteries already installed in the photodiode housing. To check the batteries, you can use a voltmeter to measure the voltage between the output ground terminal and each battery test terminal. The battery test points are located on the side panel. You should replace the batteries if the voltage is less than 6 volts.
THE MONOCHROMATIC LIGHT BEAMS
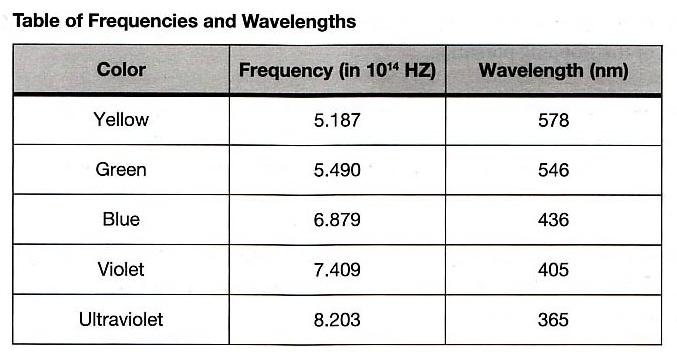
This experiment requires the use of several different monochromatic light beams, which can be obtained from the spectral lines that make up the radiation produced by excited mercury atoms. The light is formed by an electrical discharge in a thin glass tube containing mercury vapor, and harmful ultraviolet components are filtered out by the glass envelope. Mercury light has five narrow spectral lines in the visible region — yellow, green, blue, violet, and ultraviolet — which can be separated spatially by the process of diffraction. For this purpose, we use a high-quality diffraction grating with 6000 lines per centimeter. The desired wavelength is selected with the aid of a collimator, while the intensity can be varied with a set of neutral density filters. A color filter at the entrance of the photodiode is used to minimize room light.
The equipment consists of a mercury vapor light housed in a sturdy metal box, which also holds the transformer for the high voltage. The transformer is fed by a 115-volt power source from an ordinary wall outlet. In order to prevent the possibility of getting an electric shock from the high voltage, do not remove the cover from the unit when it is plugged in.
To facilitate mounting of the filters, the light box is equipped with rails on the front panel. The optical components include a fixed slit (called a light aperture) which is mounted over the output hole in the front cover of the light box. A lens focuses the aperture on the photodiode window. The diffraction grating is mounted on the same frame that holds the lens, which simplifies the setup somewhat. A “blazed” grating, which has a preferred orientation for maximal light transmission and is not fully symmetric, is used. Turn the grating around to verify that you have the optimal orientation.
The variable transmission filter consists of computer-generated patterns of dots and lines that vary the intensity of the incident light. The relative transmission percentages are 100%, 80%, 60%, 40%, and 20%.
INITIAL SETUP
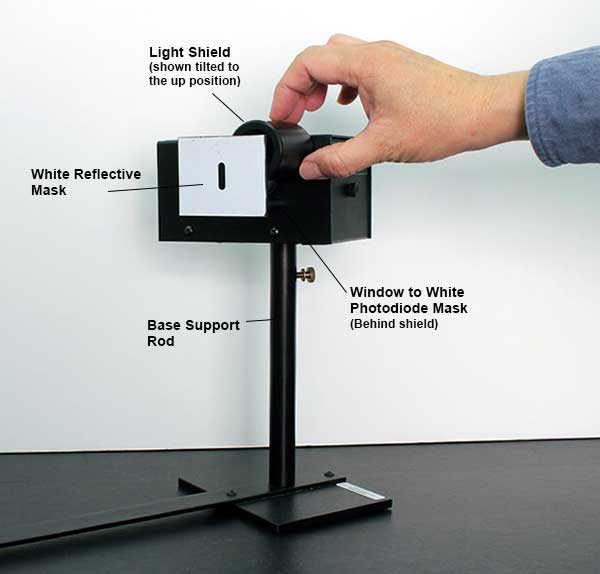
Your apparatus should be set up approximately like the figure above. Turn on the mercury lamp using the switch on the back of the light box. Swing the \(h/e\) apparatus box around on its arm, and you should see at various positions, yellow green, and several blue spectral lines on its front reflective mask. Notice that on one side of the imaginary “front-on” perpendicular line from the mercury lamp, the spectral lines are brighter than the similar lines from the other side. This is because the grating is “blazed”. In you experiments, use the first order spectrum on the side with the brighter lines.

Your apparatus should already be approximately aligned from previous experiments, but make the following alignment checks. Ask you TA for assistance if necessary.
Check the alignment of the mercury source and the aperture by looking at the light shining on the back of the grating. If necessary, adjust the back plate of the light-aperture assembly by loosening the two retaining screws and moving the plate to the left or right until the light shines directly on the center of the grating.
With the bright colored lines on the front reflective mask, adjust the lens/grating assembly on the mercury lamp light box until the lines are focused as sharply as possible.
Roll the round light shield (between the white screen and the photodiode housing) out of the way to view the photodiode window inside the housing. The phototube has a small square window for light to enter. When a spectral line is centered on the front mask, it should also be centered on this window. If not, rotate the housing until the image of the aperture is centered on the window, and fasten the housing. Return the round shield back into position to block stray light.
Connect the digital voltmeter (DVM) to the “Output” terminals of the photodiode. Select the 2 V or 20 V range on the meter.
Press the “Push to Zero” button on the side panel of the photodiode housing to short out any accumulated charge on the electronics. Note that the output will shift in the absence of light on the photodiode.
Record the photodiode output voltage on the DVM. This voltage is a direct measure of the stopping potential.
Use the green and yellow filters for the green and yellow mercury light. These filters block higher frequencies and eliminate ambient room light. In higher diffraction orders, they also block the ultraviolet light that falls on top of the yellow and green lines.
PROCEDURE PART 1: DEPENDENCE OF THE STOPPING POTENTIAL ON THE INTENSITY OF LIGHT
Adjust the angle of the photodiode-housing assembly so that the green line falls on the window of the photodiode.
Install the green filter and the round light shield.
Install the variable transmission filter on the collimator over the green filter such that the light passes through the section marked 100%. Record the photodiode output voltage reading on the DVM. Also determine the approximate recharge time after the discharge button has been pressed and released.
Repeat steps 1 – 3 for the other four transmission percentages, as well as for the ultraviolet light in second order.
Plot a graph of the stopping potential as a function of intensity.
PROCEDURE PART 2: DEPENDENCE OF THE STOPPING POTENTIAL ON THE FREQUENCY OF LIGHT
You can see five colors in the mercury light spectrum. The diffraction grating has two usable orders for deflection on one side of the center.
Adjust the photodiode-housing assembly so that only one color from the first-order diffraction pattern on one side of the center falls on the collimator.
For each color in the first order, record the photodiode output voltage reading on the DVM.
For each color in the second order, record the photodiode output voltage reading on the DVM.
Plot a graph of the stopping potential as a function of frequency, and determine the slope and the \(y\)-intercept of the graph. From this data, calculate \(W_0\) and \(h\). Compare this value of \(h\) with that provided in the “Introduction” section of this experiment.
Procedure Part 1:
Photodiode output voltage reading for 100% transmission =
Approximate recharge time for 100% transmission =
Photodiode output voltage reading for 80% transmission =
Approximate recharge time for 80% transmission =
Photodiode output voltage reading for 60% transmission =
Approximate recharge time for 60% transmission =
Photodiode output voltage reading for 40% transmission =
Approximate recharge time for 40% transmission =
Photodiode output voltage reading for 20% transmission =
Approximate recharge time for 20% transmission =
Photodiode output voltage reading for ultraviolet light =
Approximate recharge time for ultraviolet light =
Plot the graph of stopping potential as a function of intensity using one sheet of graph paper at the end of this workbook. Remember to label the axes and title the graph.
Procedure Part 2:
First-order diffraction pattern on one side of the center:
Photodiode output voltage reading for yellow light =
Photodiode output voltage reading for green light =
Photodiode output voltage reading for blue light =
Photodiode output voltage reading for violet light =
Second-order diffraction pattern on the other side of the center:
Plot the graph of stopping potential as a function of frequency using one sheet of graph paper at the end of this workbook. Remember to label the axes and title the graph.
Slope of graph =
\(y\)-intercept of graph =
\(W_0\) =
\(h\) =
Percentage difference between experimental and accepted values of \(h\) =

{:instructional:lab_manuals:physics:6c:experiment_7:photo_graph_2.jpg|}}

Table of Contents
- 18.1. Background
- 18.2. Experimental Equipment
- 18.3. Pre-Lab Preparation
- 18.4. Experimental Procedure
- 18.5.1. Analysis hints:
Related Topics
- Previous: 17. Lenses and Optical Instruments
- Next: 19. PN-Junction
Quick search
18. the photo-electric effect ¶, 18.1. background ¶.
The experiment serves to demonstrate the photoelectric effect, for which Einstein was awarded a Nobel prize, and in the process determine Planck’s constant, \(h\) .
The photoelectric effect is the process whereby a photon of energy \(E=h\nu\) , incident on the surface of a conductor, transfers its energy to one of the electrons of an atom. If the energy is sufficient, the electron can not only escape from the material, but do so with a certain amount of kinetic energy. If the electron is in the highest available energy state within the conductor, the least amount of energy, \(\phi\) , is needed to free it, and it will escape with the maximum kinetic energy. \(\phi\) is called the work function of the conducting material.

Fig. 18.1 Schematic of the photo-electric effect experiment. A photon hits the conducting anode and knocks out an electron. All electrons that have sufficient kinetic energy to reach the cathode produce an electric current. The adjustable stopping voltage determines the minimal kinetic energy the electrons need. 
If the conductor forms the anode of a phototube, as shown in Fig. 18.1 , no electrons will reach the cathode if the potential difference ( retarding potential ) between the anode and cathode is adjusted to the minimum value necessary to stop the fastest electrons. The loss of kinetic energy is then balanced by the gain of potential energy, \(e V_s\) , and the energy equation is given by
where \(V_s\) is called the stopping potential . The threshold frequency , \(\nu_0\) , is the minimum photon frequency capable of eliciting the photoelectric effect. It is obtained by setting \(V_s = 0\) in equation (18.1) :
In the experiment, a monochromator is used to isolate a number of different wavelengths from a mercury lamp, and for each the stopping potential is determined. From the data, \(h\) , \(\phi\) , and \(\nu_0\) may be determined.
18.2. Experimental Equipment 
The setup for this experiment is shown in Fig. 18.2 . It consists of a mercury lamp, a monochromator, the photocell with a control for the stopping voltage and a current amplifier with a zero adjust for the photo-current measurement. Be careful with the mercury lamp. It is made of quartz, emits UV and gets very hot .

Fig. 18.2 Overview of the main equipment parts of the photo-electric effect experiments. 
You will also need two additional digital multimeters to measure the stopping voltage and the photo current. A close-up of the instrument is shown in Fig. 18.3 .

Fig. 18.3 The monochromator and the instrument containing the photocell. The instrument can be removed when the sleeve is pushed toward the monochromator. Then the exit slit can be viewed to select which Hg spectral line is used. Then you remove the instrument make sure that it is either turned off or that the stopping voltage is at a maximum (know turned CW as far as it goes) 
The wavelength can be adjusted by turning the knob at the side if the monochromator (this rotates the grating inside the monochromator). An arrow indicates the direction towards shorter \(\lambda\) .
18.3. Pre-Lab Preparation 
Assume you have determined that the stopping voltage for the yellow light is 0.5V and it is 1.5V for the ultraviolet light. Determine the value of hc? The wavelengths of the mercury spectrum can be found in the manual. Express the results using the unit of ev*nm.
Prepare the data file formats for each wavelength and store the wavelength as a parameter in the header section.
Prepare a python script to plot your data while you are taking them. This makes sure that you have good quality data.
18.4. Experimental Procedure 
DAMAGE COULD RESULT IF THE UNIT IS TURNED ON WHILE THE PHOTOELECTRIC CELL IS EXPOSED TO ROOM LIGHT OR INTENSE LIGHT
Turn on the mercury lamp and wait for about 5 minutes until it reaches its full intensity. Connect one of the digital multimeters to measure the retarding potential and set it to the 20 V DC range.
Connect the second multimeter to measure the photoelectric cell current (thereby duplicating the reading on the less accurate built-in milliammeter) and set it to the 2 mA DC range.
By turning the wavelength control on the side of the monochromator, different spectral lines will become visible at the exit slit. Those to be used are: yellow (578 nm), green (546 nm), blue (436 nm) violet (405) and ultra-violet (365 nm). The violet appears relatively faint and the ultra-violet is, of course, invisible.
Adjust the wavelength control until the yellow line is visible.
Place the photoelectric cell on the stand forming a light tight seal with the monochromator.
Turn the “voltage adjust” control fully clockwise (maximum retarding potential) and then switch on the power switch.
Cover the entrance slit of the monochromator to prevent light entering and adjust the “zero adjust” until zero current is obtained. This is a very delicate adjustment and you may not be able to obtain a precise zero.
Let the light back into the system. Turn the “voltage adjust” control in a counter-clockwise direction, thereby reducing the retarding potential, until a current of about 1 mA is registered. Now adjust the wavelength control until the current is maximum. You have now optimized the monochromator for 578 nm.
Turn the “voltage adjust” control fully clockwise (maximum retarding potential) Before recording the “stopping potential”, double check the zero setting, blocking the light as before. After you let the light back into the system you will notice a small negative current which is normal. Try to figure out where this current is coming from.
Measure the current as a function of the retarding potential by reducing the retarding voltage first in step of 0.5 V and as soon as you see a noticeable change in the photo current decrease the voltage steps in such a way that you have about 10 measurements in the ‘knee region’ and data up to a current of about 0.5 mA. You should end up with about 15 - 20 data points for each color.
Having completed this wavelength, turn the “voltage adjust” control fully clockwise and remove the photoelectric cell so that you can adjust the monochromator for the next spectral line. Repeat the above procedures for each line in turn. The ultra- violet line will have to be found by adjusting the wavelength control beyond the position for the violet line until a current is registered. Keep adjusting the “voltage adjust” control to prevent the current reading from going off-scale while seeking the maximum current.
18.5. Analysis 
The goal of the analysis is to carefully determine the minimal retarding voltage from which one can determine kinetic energy of the ejected photo-electrons.

Fig. 18.4 Typical current vs. stopping voltage ( \(V_s\) ) curve for the UV line. Note the ‘knee` and the two limiting lines fitted to determine the range of values for the stopping voltage. 
Each data set taken for a specific wavelength needs to be analyzed separately and the general method is as follows:
Plot the measured current, \(I\) as a function of the stopping potential \(V_s\) . A typical example is shown in Fig. 18.4 . Note that the current increases smoothly and it is not obvious how to determine the exact value of the minimal value of \(V_s\) . A possibility is so fit a line to the data where \(V_s\) is large and the current changes only lightly. In the area where you see the ‘knee’ in the curve select a second range of points where the current starts to rise (typically a current increase of 200 - 400 \(\mu A\) works well). Fit a second line to these data and calculate the intersection of the two lines. The value for \(V_s\) at the intersection can then be interpreted as the minimal stopping potential to prevent electrons from reaching the anode and the potential energy of the electrons when they just reach the anode corresponds to their kinetic energy when the were just ejected from the cathode. In order to get an estimate of the uncertainty use limiting cases in your selection of data points to determine these two lines (see Fig. 18.4 )
Use the voltages and their uncertainties determined in the previous step to determine \(h\) and \(\phi\) by fitting a line to the measured electron energies as a function of the frequency of the light.
Why to you measure a current in the opposite direction of the photo current when \(V_s\) is maximal and you carefully zeroed the current measurement.
18.5.1. Analysis hints: 
How to fit a line to a subset of data of \(I\) and \(V\) ?:
Select the data using:
Here ir contains the information on the data where the current I is between -0.1 and 0.3. The fit results are stored in l1. The most important are: l1.slope and l1.offset and their uncertainties, l1.sigma_offset and lq.sigma_slope . For further information check the general documentation.
If you prefer to select data using the voltage you would do:
Here vh contains the information on the data where the voltage V is between 1.5 and 3.5 and the fit results are stored in l2.
Instead of using B.in_between you can also do:
which is what B.in_between actually does.
- To understand the phenomenon Photoelectric effect as a whole.
- To draw kinetic energy of photoelectrons as a function of frequency of incident radiation.
- To determine the Planck's constant from kinetic energy versus frequency graph.
- To plot a graph connecting photocurrent and applied potential.
- To determine the stopping potential from the photocurrent versus applied potential graph.
During his experiments on electromagnetic radiation (to demonstrate light consists of e-m waves), Hertz noticed a spark between the two metallic balls when a high frequency radiation incident on it. This is called photoelectric effect. Photoelectric effect is the emission of electrons when electromagnetic radiations having sufficient frequency incident on certain metal surfaces. We call the emitted electrons as photoelectrons and the current they constitute as photocurrent. The phenomenon was first observed by Heinrich Hertz in 1880 and explained by Albert Einstein in 1905 using Max Planck's quantum theory of light. As the first experiment which demonstrated the quantum theory of energy levels, photoelectric effect experiment is of great historical importance.
The important observations on Photoelectric effect which demand quantum theory for its explanation are:
- The Photoelectric effect is an instantaneous phenomenon. There is no time delay between the incidence of light and emission of photoelectrons.
- The number of photoelectrons emitted is proportional to the intensity of incident light. Also, the energy of emitted photoelectrons is independent of the intensity of incident light.
- The energy of emitted photoelectrons is directly proportional to the frequency of incident light.
The basic experimental set up which explains Photoelectric effect is as given below,
.jpg "photoelectric effect experiment lab")
escape from a particular metal surface and is called work function 'W' for that
metal. The work function can be expressed in terms of frequency as,
Where h is the Planck's constant and
The work function for some metals are listed in the table.
According to Einstein the Photoelectric effect should obey the equation,
From the above expression,

Graph connecting 'KE max ' and frequency:
Maximum kinetic energy of photoelectrons versus frequency of incident radiation graph
Now, if we increase the reverse potential, the photocurrent gradually decreases and becomes zero at a particular reverse potential. This minimum applied reverse potential is called stopping potential V 0 . Hence the maximum kinetic energy of photoelectrons can be written as,
Graph connecting photocurrent and applied reverse potential :
For constant intensity and different frequencies, for constant frequency and different intensities.
Cite this Simulator:
Browse Course Material
Course info.
- Physics Department Faculty, Lecturers, and Technical Staff
Departments
As taught in.
- Atomic, Molecular, Optical Physics
Learning Resource Types
Experimental physics i & ii "junior lab", photoelectric effect, description.

Photoelectric effect experiment equipment. (Image courtesy of MIT Junior Lab staff.)
The maximum kinetic energy of electrons ejected from a metal surface by monochromatic light is measured for several wavelengths. The value of Planck’s constant, h, is derived by an analysis of the data in the light of Einstein theory of the photoelectric effect.
Photoelectric Effect Lab Guide (PDF)
Planck, Max. Nobel Prize Lecture, “ The Genesis and Present State of Development of the Quantum Theory .” (1918).
Einstein, Albert. Nobel Prize Lecture, “ Fundamental Ideas and Problems of the Theory of Relativity .” (1921).
Millikan, R.A. “ A Direct Photoelectric Determination of Planck’s ‘h’ .” Phys. Rev ., 7, 355 (1916).
Hughes, Arthur L., and Lee A. Du Bridge. Photoelectric Phenomena . Boston, MA: McGraw-Hill, (1932).
Discusses phenomena such as the velocity distribution of the electrons, effects of polarization and angle of incidence of the light, influence of the surface temperature, photoelectric behavior of thin films and composite materials, etc.
Harnwell, G. P., and Livingood, J. J. “Thermionic and Photoelectric Effects.” In Experimental Atomic Physics . Boston, MA: McGraw-Hill, 1933, pp. 214-223. ISBN: 9780070266605.
Melissinos, Adrian C. “Photoelectric Effect.” In Experiments in Modern Physics . New York, NY: Academic Press, (1968).
Selected Resources
Baumeister, P. and G. Pincus. “Optical Interference Coatings.” Scientific American 223, 58-75 (December 1970).

You are leaving MIT OpenCourseWare
IMAGES
COMMENTS
The photoelectric effect was able to be observed from the first part of the experiment due to the backing voltage of 0V and tube current of 0μA. In the second part, the planck’s constant of 1 × 10 − 28 J was able to determine from the graph of stopping or backing voltage versus frequency and in comparison, with the accepted value of the ...
This experiment requires the use of several different monochromatic light beams, which can be obtained from the spectral lines that make up the radiation produced by excited mercury atoms. The light is formed by an electrical discharge in a thin glass tube containing mercury vapor, and harmful ultraviolet components are filtered out by the ...
Nov 14, 2024 · The experiment serves to demonstrate the photoelectric effect, for which Einstein was awarded a Nobel prize, and in the process determine Planck’s constant, \(h\). The photoelectric effect is the process whereby a photon of energy \(E=h\nu\) , incident on the surface of a conductor, transfers its energy to one of the electrons of an atom.
1 day ago · As the first experiment which demonstrated the quantum theory of energy levels, photoelectric effect experiment is of great historical importance. The important observations on Photoelectric effect which demand quantum theory for its explanation are: The Photoelectric effect is an instantaneous phenomenon.
Lab Reports for EIO and Prelab Questions for Ell are due at the beginning of this lab. Objectives Understand how ejection of photoelectrons from a metal surface depends on the frequency and intensity of incident light. Measure Planck's constant and the work function for the cathode material. Theoryl The photoelectric effect is one of several ...
The Photoelectric Effect MIT Department of Physics The objective of this experiment is to demonstrate the quantization of energy in electromagnetic waves and to determine Planck’s constant h. You will measure the maximum kinetic energy of electrons ejected by the photoelectric effect from an alkali metal surface as a function of frequency.
The Photoelectric Effect One weight . 1. Objective . Students will be introduced to the photoelectric effect and two competing theoretical explanations of the effect. In a series of measurements, they will differentiate between the two theoretical explanations and determine which best agrees with their observations. 2. Introduction . Discovery
2/12 /01 1 Lab 2 -8 EXPERIMENT 2 -8 THE PHOTO -ELECTRIC EFFECT The photoelectric effect was the first direct experiment to demonstrate the quantum n ature of electromagnetic energy transfer to and from matter. The purpose of this exper iment is to verify Einstein's theory of the photoelectric effect, to measure Planck's co nstant, and to
Photoelectric effect experiment equipment. (Image courtesy of MIT Junior Lab staff.) The maximum kinetic energy of electrons ejected from a metal surface by monochromatic light is measured for several wavelengths. The value of Planck’s constant, h, is derived by an analysis of the data in the light of Einstein theory of the photoelectric effect.
the photoelectric effect and Einstein’s explanation. Instructor’s Expectations During the lab session students • Assemble the apparatus; • Make a sketch, or a photo, or use any available source to present the working setup in the lab report with main parts of the apparatus linked to the drawing in Fig. 2; • Perform exercises detailed ...